. 2019 Sep 12;8:e48496. doi: 10.7554/eLife.48496

Figure 5. Monomeric P2 bound to P5.

Localized asymmetric reconstruction of the vertex complex showing the two protruding densities as gray surfaces where (A) is the side view and (B) is the top view. P2 (orange), P5 N-terminal base (bright pink) and P31 (yellow) structures fitted into these map densities. (C) Isolated CryoEM density that represents the P2 subunit. It represents the region highlighted by the blue box in (A) and (B). (D and E) Superimposed vertex maps with P2 bound (yellow) and without P2 bound (gray). In classes where P2 is bound to P5, the stalk region is nudged by ≈35.60 when compared to the classes where P2 is not bound to P5. Chimera: Volume Trace tool was used to place the red spheres in the density and Chimera: Measure Angles tool to determine the angles.

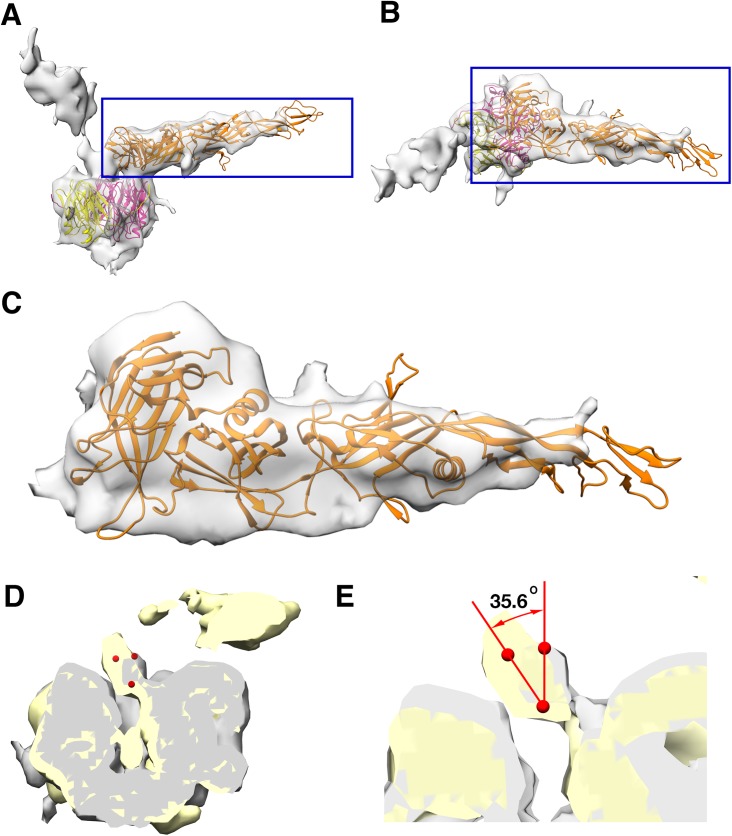
Figure 5.

Figure 5—figure supplement 1. Maps generated by localized reconstruction of the sub-particles.

Figure 5—figure supplement 1.

Top row shows all the maps that were generated by the localized reconstruction followed by initial 3D classification without image alignment and the bottom row shows the 45o tilted counterparts of the maps displayed in the top row. The map highlighted by the blue rectangle shows the class that was selected and the 3D classification was further refined with local image alignment. In this case, the resolution of the localized reconstruction was about 10 Å. No tight masks were used during the 3D classification to avoid any masking bias. This results in a lower resolution map but the maps are more reliable.
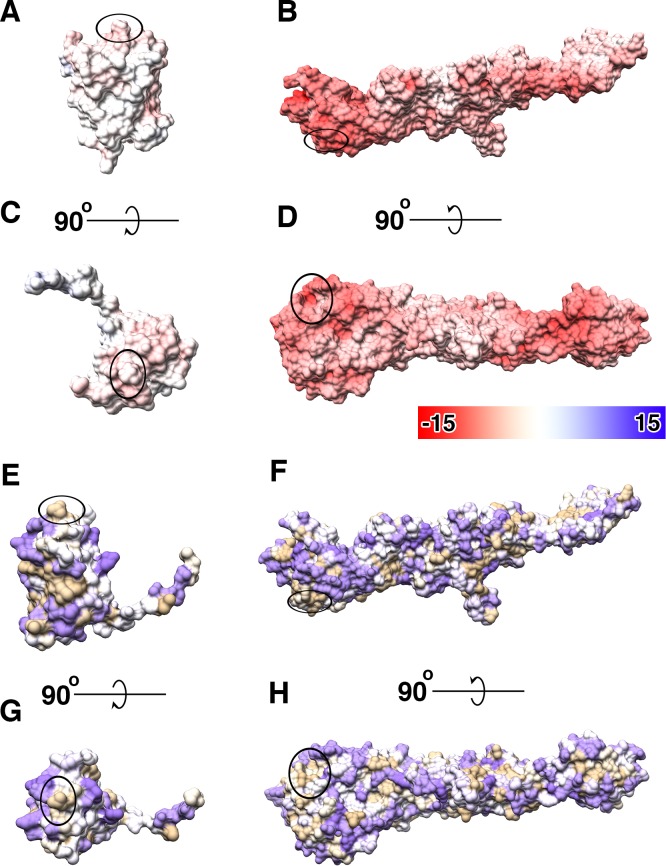
Figure 5—figure supplement 2. Distribution of electrostatic potential and hydrophobic surface in P2 and P5.

Figure 5—figure supplement 2.

(A–D) Show the distribution of coulombic electrostatic potential on the surface of P2 and P5 where red represents negative potential, blue represents positive potential and white for neutral. (E–H) Show the distribution of hydrophobic residues on the surface of P2 and P5 (according to Kyte and Doolittle scale) where purple represents least hydrophobic residues, brown represents most hydrophobic residues and white for neutral residues. The highlighted regions on all the images shows the region of interaction between the N-terminal domain of P5 and P2.
Figure 5—video 1. Shows the distribution of coulombic electrostatic potential on the surface of P2 and P5 and the regions of interaction between the N-terminal domain of P5 and P2.
Download video file (10.1MB, mp4)
DOI: 10.7554/eLife.48496.022