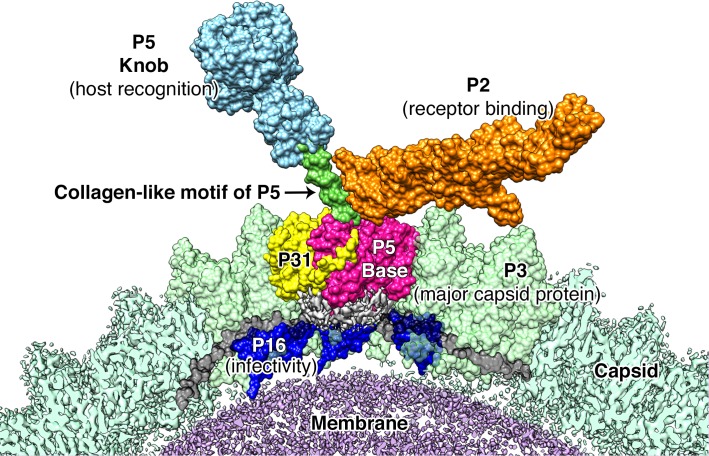
Figure 7. Proposed model for the vertex region.
Shows the structural arrangement of P5 (P5 N-terminal base shown in bright pink, Collagen-like motif of P5 shown in bright green and P5 Knob is shown in pale blue), P31 (yellow) and P2 (orange) that form the vertex. The region below the vertex complex (shown as a gray density) is the unorganized/unmodeled region that links the surrounding P16 (blue) and the P30 (black). Capsid is shown in pale green (raw CryoEM map is labeled as Capsid and the modeled region is labeled as P3). The lipid membrane is shown in purple.

