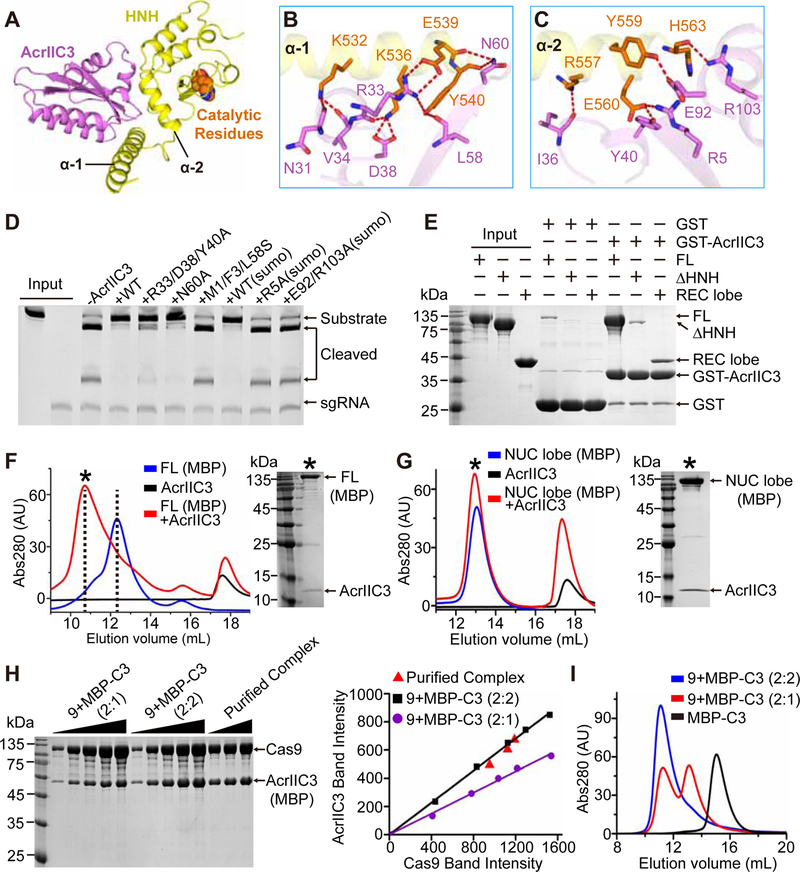
Figure 5. Interactions between AcrIIC3 and Cas9.
(A) Overall structure of AcrIIC3 (purple) in complex with the HNH domain of NmeCas9 (yellow). The catalytic residues of the HNH domain are shown in space-filling representation and orange color.
(B, C) Hydrogen bonding between AcrIIC3 and α 1 (B) and α 2 (C) helixes of the HNH domain. Same color code as in (A).
(D) DNA cleavage by NmeCas9 to test mutations in the HNH-binding surface of AcrIIC3.
(E) Pull-down analysis of AcrIIC3-NmeCas9 interactions. GST-tagged AcrIIC3 was incubated with different NmeCas9 constructs and the complexes were pulled down and analyzed by SDS-PAGE.
(F) Elution profiles of SEC runs on Superdex 200 10/300 column to test binding of AcrIIC3 to the MBP-tagged full-length (FL) NmeCas9.
(G) Elution profiles of SEC runs of the MBP-tagged NUC lobe of NmeCas9 complexed with AcrIIC3. Note that only FL but not the NUC lobe has a large shift in elution volume upon binding to AcrIIC3. Black asterisks indicate the fractions analyzed by SDS-PAGE.
(H) SDS-PAGE analysis (left panel) and quantitative measurement (right panel) for the purified AcrIIC3-Cas9 complex and the standard samples with 1:2 and 2:2 molar ratios of AcrIIC3 and Cas9, respectively.
(I) Elution profiles of SEC runs for MBP-AcrIIC3 alone and mixtures of AcrIIC3 and Cas9 at the 1:2 and 2:2 molar ratio.
See also Figures S5, S6 and Table 1.

