Figure 5.

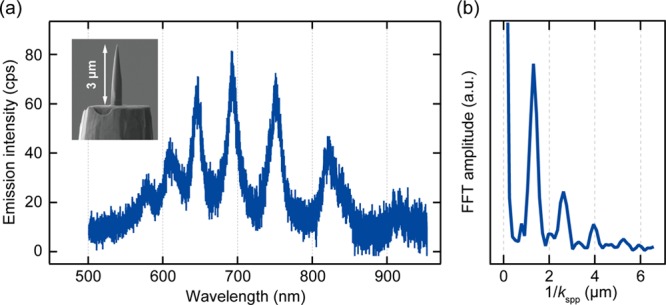
STL spectrum of a polished tip with a flat base. (a) STL spectrum obtained with the tip shown in the inset SEM image (Vbias = 2.5 V, It = 6 nA). (b) Fourier spectrum of (a) executed for the interpolated data with kspp.

STL spectrum of a polished tip with a flat base. (a) STL spectrum obtained with the tip shown in the inset SEM image (Vbias = 2.5 V, It = 6 nA). (b) Fourier spectrum of (a) executed for the interpolated data with kspp.