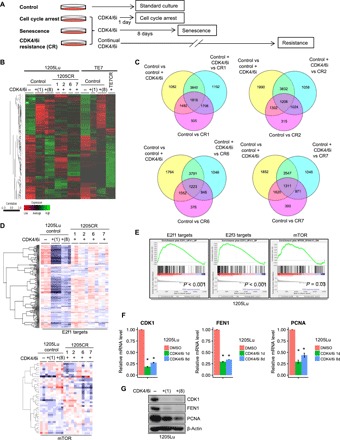
Fig. 1. Comprehensive analyses of CR cells.

(A) Scheme for exposure of melanoma-derived cell lines to palbociclib and outcome. (B) Heat map with hierarchical clustering of samples from 1205Lu cells (control), 1205Lu cells treated with palbociclib (1 μM) for 1 or 8 days, and CR clones (1205CR1, 1205CR2, 1205CR6, and 1205CR7) (left) and TE7 cells treated with palbociclib (1 μM) for 1 or 8 days and CR cells (TE7CR) (right). (C) Venn diagrams of differentially expressed genes of samples [dimethyl sulfoxide (DMSO) versus palbociclib treatment (1 μM) for 8 days (control versus control + CDK4/6i), palbociclib treatment (1 μM) for 8 days versus 1205CR1, 1205CR2, 1205CR6, or 1205CR7 (CDK4/6i versus CR1, CR2, CR6, or CR7), control + palbociclib (CDK4/6i) versus CR1, CR2, CR6, or CR7 (q < 0.1)]. (D) Heat map of 1205Lu cells from (B) for expression of E2f target genes and mTOR signaling. (E) GSEA analysis of CR cells compared to senescent cells [palbociclib treatment (1 μM) for 8 days] for E2f1 targets (P < 0.001), E2f3 targets (P < 0.001), and mTOR signaling (P = 0.03). (F and G) Samples from 1205Lu cells with or without treatment of palbociclib (1 μM) for 24 hours or 8 days were prepared. (F) Quantitative polymerase chain reaction (qPCR) analysis using sets of primers for CDK1, FEN1, and PCNA. Data were normalized by glyceraldehyde-3-phosphate dehydrogenase (GAPDH) and represent means ± SD. *P < 0.01 (one-sample two-tailed Student’s t test; n = 3). (G) Western blot analysis using antibodies to CDK1, FEN1, PCNA, and β-actin.
