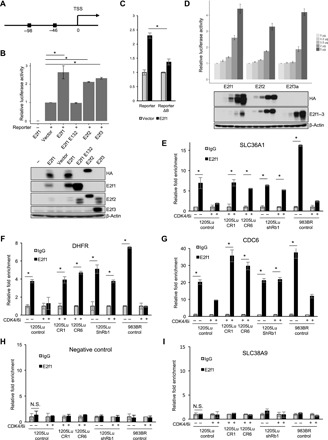
Fig. 4. SLC36A1 is an E2f target gene.

(A) Schematic of the SLC36A1 promoter. Boxes indicate the positions of putative E2f1 binding motifs. (B) Luciferase assays of lysates from HEK293T cells transfected with luciferase reporter construct containing SLC36A1 promoter (Reporter) and secreted alkaline phosphatase (SEAP) together with either empty vector, E2f1, E2f1 E132 (E2f1m), E2f2, or E2f3a. Data were normalized by SEAP for each sample (top). Data were normalized by SEAP and represent means ± SD, *P < 0.01 (one-sample two-tailed Student’s t test; n = 3). Western blot analysis of samples from (B) (top) using antibodies indicated on the right of the panel (bottom). (C) Luciferase assays of lysates from HEK293T cells transfected with Reporter or Reporter lacking of putative E2F1 binding sites (Reporter ΔB) and SEAP together with either empty vector or E2f1. Data were normalized by SEAP and represent means ± SD. *P < 0.01 (one-sample two-tailed Student’s t test; n = 3). (D) Luciferase assays of lysates from HEK293T cells transfected with Reporter and SEAP together with different amount plasmids of E2f1, E2f2, or E2f3a (0, 0.2, 0.5, 2, and 5 μg). Data were normalized by SEAP for each sample (top). Western blot analysis of samples from (C) (top) using antibodies indicated on the right of the panel (bottom). (E to I) The fixed chromatin of 1205Lu cells with or without treatment of palbociclib (1 μM) for 24 hours, 1205CR1 proliferating with palbociclib (1 μM), 1205CR6 proliferating with palbociclib (1 μM), 1205Lu cells introduced shRb with or without treatment of palbociclib (1 μM) for 24 hours, and 983BR cells with or without treatment of palbociclib (1 μM) for 24 hours was analyzed by chromatin immunoprecipitation (ChIP) assay using specific antibodies to control immunoglobulin G (IgG) (gray bars) or E2f1 (black bars). Precipitated DNA was subjected to qPCR analysis using sets of primers recognizing sequences that flank the E2f1 putative binding sites (SLC36A1) (E) or sequences that do not contain E2f motifs (negative control) (H). E2f binding to dihydrofolate reductase (DHFR) (F), CDC6 (G), or SLC38A9 (I) served as controls. Data were normalized by IgG and represent means ± SD, *P < 0.01 (two-tailed Student’s t test; n = 3). N.S., not significant (n = 3).
