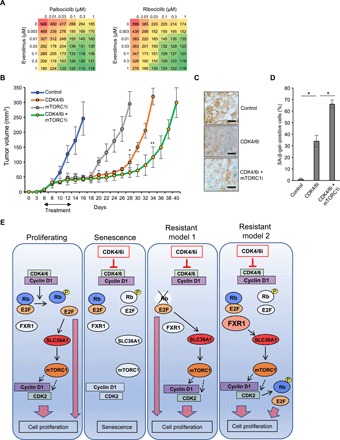
Fig. 6. Synergistic effects of a CDK4/6i and an mTORC1 inhibitor.

(A) Cell proliferation assay of 1205Lu cells treated with palbociclib (left) or ribociclib (right) at varying concentrations (0, 0.01, 0.03, 0.1, 0.3, and 1 μM) and everolimus at varying concentrations (0, 0.003, 0.01, 0.03, 0.1, 0.3, and 1 μM) for 4 days. Red indicates high cell number, and green color indicates low cell number. (B) A total of 2 × 10⁶ cells of 1205Lu cells were subcutaneously injected into 6-week-old SCID mice. Treatments (palbociclib; 90 mg/kg) by oral gavage, everolimus (10 mg/kg) by intraperitoneal injection, or palbociclib (45 mg/kg) + everolimus (10 mg/kg) were initiated when tumors reached to 2 mm of diameter as indicated with arrows. Each group, 10 tumors; tumor volumes were measured every 2 days. Data represent means ± SD from n = 10 tumors per group, *P < 0.001 (two-tailed Student’s t-test; control versus palbociclib or everolimus, n = 10) and **P < 0.001 (two-tailed Student’s t-test; palbociclib versus palbociclib + everolimus, n = 10). (C) Representative images of SA-β-gal staining in fresh primary tumors culture on the dental sponges in cell culture medium with palbociclib (1 μM), rapamycin (50 nM), or palbociclib (1 μM) + rapamycin (50 nM) for 8 days (n = 3). Scale bars, 50 μm. (D) Quantification of SA-β-gal–positive cells from (C). Data represent means ± SD, *P < 0.01 (two-tailed Student’s t test; n = 3). (E) Model of CDK4/6i-induced senescence and its acquired resistance in melanoma.
