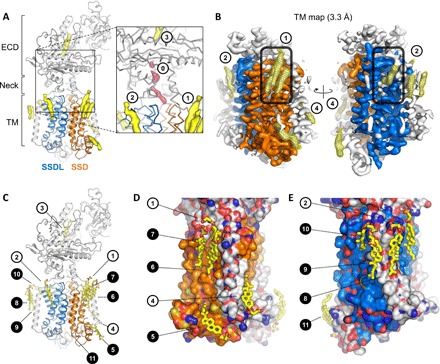
Fig. 2. Bound sterol molecules revealed by the PTCH1Δ-ShhNC24II structure.

(A) The 3D reconstruction features several well-resolved density elements in the ECD region and surrounding the TM domains of PTCH1Δ (isolated density are colored yellow). The SSD (TM2–6) and the SSDL (TM8–12) are colored orange and blue. Inset: Previously observed sterol sites are indicated as sites 1, 2, and 3; additional partial density is present in the neck region of PTCH1Δ (site 0, pink), suggesting partial occupancy of the site. (B) Focused density map of the TM region (TM map) indicates the well-resolved sites 1, 2, and 4, as well as a number of novel sites, indicated with a mesh; the pocket region within the SSD and the corresponding SSDL is indicated by a rounded rectangle. (C) The CHS molecules were modeled into the well-defined density map regions (B) using 10σ cutoff of the unsharpened refined density map. The closed circles correspond to the novel sterol sites revealed by the PTCH1Δ-ShhNC24II reconstruction. (D and E) Views of the sterols surrounding the SSD and SSDL domains. The protein model is shown as a surface, colored according to atom type; carbon atoms in the SSD and SSDL are colored orange and blue, respectively.
