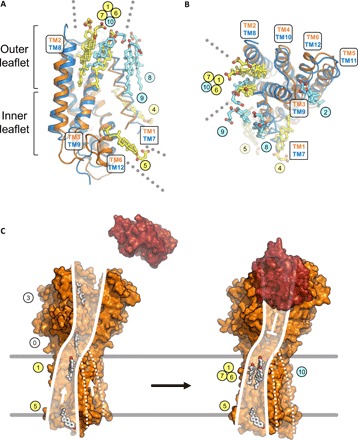
Fig. 4. Sterol binding site overlap observed at the SSD and SSDL domains of PTCH1.

(A and B) The M1 and M2 regions of PTCH1Δ were aligned using the SSD (orange) and SSDL domains (blue). The SSD and SSDL regions are represented as cartoons; the TM helices TM1 and TM7 are shown as ribbons. Sterols bound at the SSD (yellow) and SSDL regions (light blue) are labeled using corresponding colored circles. The outer leaflet sites 1, 6, and 7 at the SSD and site 10 at the SSDL overlap. The dotted lines in (A) and (B) indicate access of sterols via the inner leaflet to site 5 (SSD) and via the outer leaflet to pocket sites 1, 6, and 7 (SSD) and site 10 (SSDL). (C) Putative model of sterol translocation via PTCH1. Left: In the absence of hedgehog ligand (red), the protein (illustrated using PDB ID: 6D4H) moves the inner leaflet sterols along the path formed by the SSD. Right: Binding of the ligand negatively regulates this activity; the sterols accumulate at the SSD pocket region, evidenced by our 3D reconstruction. Presence of sterols at the SSDL, along with its similarity with SSD, may suggest a similar functional role (marked by the dashed lines).
