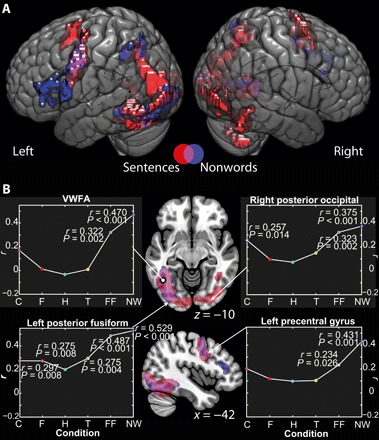
Fig. 1. Brain areas whose response to orthographic stimuli is modulated by literacy.

(A) Network of brain areas showing responses modulated by literacy, projected on the single-subject MNI152 template brain. Red indicates areas whose response to viewing sentences was significantly positively correlated with literacy. Blue indicates brain areas whose response to viewing nonwords was significantly positively correlated with literacy. Magenta indicates overlap between the two. (B) Images show correlations between brain response to sentences and nonwords projected into axial and sagittal planes through the VWFA (at MNI coordinates −42, −55, −10), marked with a circle. Graphs show correlation coefficients for the relationship between literacy and brain response for visual stimuli, at peaks determined from the correlations between sentence reading and literacy; arrows indicate approximate location of peaks. Significant correlations are highlighted with white dots. r and P values are provided adjacent. Correlations that reach significance at P < 0.05 when applying a Bonferroni correction corrected for multiple comparisons within region of interest (ROI) (i.e., six comparisons) are indicated with a black dot on the white highlight. C, checkerboards; F, faces; H, houses; T, tools; FF, false fonts; NW, nonwords. Activation maps thresholded at P(unc.) < 0.001 and cluster-wise threshold of P(FWE) < 0.05.
