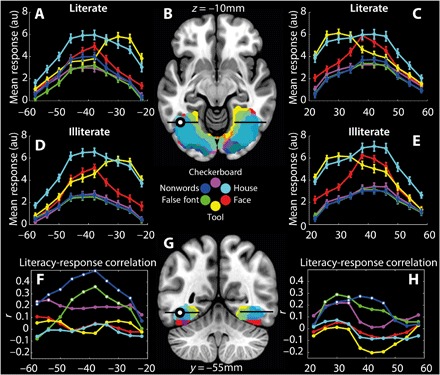
Fig. 2. Group-level activation of ventral visual areas in response to visual categories (A to G).

(B) and (G) show the significant responses at the group level to each category of stimulus presented during the visual run; planes of section are indicated in labels. Colors represent the indicated stimulus category in both brain projections and the graphs. The black line demarcates the range of x coordinates −58 to −22 mm (left) and 22 to 58 mm (right). The locus of the group VWFA is shown as a black dot filled in white. For clarity of display, only the top 5% of most significant voxels reaching the voxel-level threshold of P(unc.) < 0.001 and cluster-wise threshold of P(FWE) < 0.05 for the contrasts of each condition versus baseline are shown, projected on the MNI152 template brain. Note the substantial overlap between the activation maps of the different conditions (also evident in figs. S2 and S3). (A) and (D) respectively show the group mean responses of literate and illiterate individuals (±SEM) to each of the stimulus categories presented, at 4-mm intervals along the x axis of the plane through the group VWFA in the left hemisphere. (C) and (E) respectively illustrate the same data for the right hemisphere. (F) shows the correlation coefficient, r, for the relationship between literacy and brain response at the specified coordinates in the left hemisphere, and (H) shows the equivalent information for the right hemisphere; data points highlighted in white are those where there is a significant (P < 0.05) relationship between literacy and brain response. The correlation coefficients and their respective P values are tabulated in table S3. au, arbitrary units.
