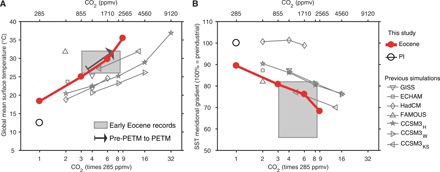
Fig. 1. Model-data comparison of the Early Eocene GMST and relative meridional SST gradient.

(A) GMST (in °C) in model simulations (markers) as a function of CO2 concentration compared with proxy estimates of the Early Eocene (gray patch) and the pre-PETM to PETM warming (black arrow). (B) Relative latitudinal gradient of SST in model simulations (markers) as a function of CO2 compared with estimates from proxies (gray patch). The CO2 ranges for the Early Eocene and PETM are from the latest estimates from proxies (1) and modeling (8), respectively. Eocene CESM1.2 simulations from this study are denoted as filled red circles. For reference, the PI simulation is marked as a black circle. Previous Eocene simulations (16, 19) including those from the Eocene Modeling Intercomparison Project (EoMIP) (3) are denoted by gray open markers. Note that methane concentrations in previous simulations that are different from the PI value have been converted to the equivalent CO2 concentration (Materials and Methods). In CCSM3KS simulations, the authors altered cloud properties substantially to account for presumed Eocene aerosol changes (16). Similarly, model physics are significantly altered in FAst Met Office/UK Universities Simulator (FAMOUS) (E17) (19).
