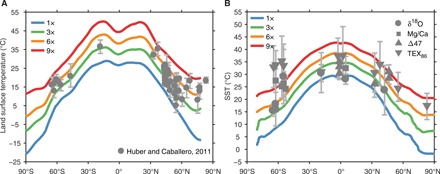
Fig. 2. Model simulated zonal mean temperature over land and ocean compared with proxy estimates.

(A) Zonal mean land surface temperature in the Eocene simulations compared with Early Eocene terrestrial proxy evidence (11). (B) Zonal mean SST in the Eocene simulations compared with published Early Eocene SST data, compiled in this study (table S1). Inferred temperatures using δ18O of planktic foraminifera, clumped isotopes, Mg/Ca of planktic foraminifera, and TEX86 are denoted as filled circles, upward-pointing triangles, squares, and downward-pointing triangles, respectively.
