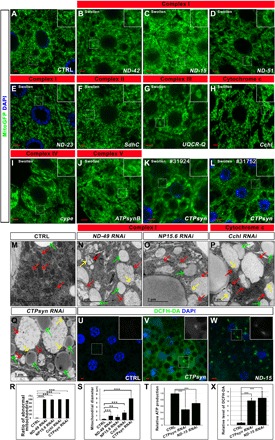
Fig. 2. The reduction of the expression of genes encoding ETC components leads to mitochondrial morphology defects.

(A) Control (CTRL). (B to J) The decrease of the ETC components led to swollen mitochondria. (K and L) The knockdown of CTPsyn by two independent RNAi lines led to a similar mitochondrial phenotype. Scale bars, 5 μm. Green signals were mitoGFP signals to indicate the mitochondrial morphology. Blue signals were nuclear DAPI staining. The boxed region in each image was enlarged and shown in the inset to present the typical mitochondrial morphology. The phenotype category for each genotype is listed on the top of the image. (M to Q) The TEM images of the fat body tissues in the animals with indicated genotypes. The swollen mitochondria (red arrows) in the RNAi tissues were identified by the remaining cristae (yellow arrows). The green arrows indicate the lipid droplets in the fat body tissues. (R) Quantification of the ratio of abnormal mitochondria (mitochondria with less cristae) in (M) to (Q). n = 4; ***P < 0.001, one-way analysis of variance (ANOVA)/Bonferroni’s multiple comparisons test. (S) Quantification of the average mitochondrial diameter in (M) to (Q). n = 6 images for each genotype; **P < 0.01; ***P < 0.001, one-way ANOVA/Bonferroni’s multiple comparisons test. (T) ATP production in the tissues with indicated genotypes. CTPsyn or ND-15 RNAi tissues had reduced ATP production. n = 3 replicates; 20 larvae per replicate; ***P < 0.001, one-way ANOVA/Bonferroni’s multiple comparisons test. (U to W) ROS production was increased in the CTPsyn or ND-15 RNAi cells. The green signals of DCFH-DA staining indicated the production of ROS. DAPI staining (blue) indicated the nuclei. Scale bars, 5 μm. (X) Quantification of the relative level of DCFH-DA in (U) to (W). n = 4 images for each genotype; ***P < 0.001, one-way ANOVA/Bonferroni’s multiple comparisons test.
