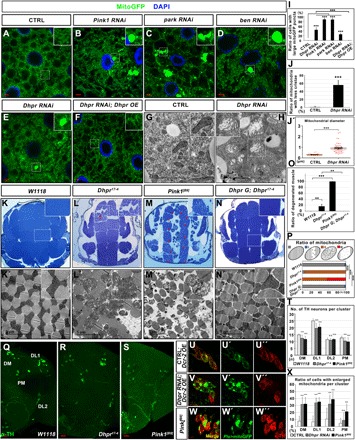
Fig. 3. The loss of Dhpr leads to mitochondrial defects similar to those in Pink1 mutant animals.

(A) Control (CTRL). (B to E) The RNAi of indicated genes in the fat body tissues led to similar mitochondrial phenotypes. (F) Dhpr overexpression (Dhpr OE) rescued the mitochondrial defects in Dhpr RNAi fat body tissues. (G and H) TEM analysis of the fat body tissues in the animals with indicated genotypes. Dhpr RNAi led to swollen of the mitochondria and the reduction of cristae in fat body tissues. (I) Quantification of the ratio of cells with large mitoGFP puncta in (A) to (F). n = 5; ***P < 0.001, one-way ANOVA/Bonferroni’s multiple comparisons test. (J) Quantification of the ratio of mitochondria with less cristae in (G) to (H). n = 3 images of each genotype; ***P < 0.001, two-tailed unpaired Student’s t test. (J′) Quantification of the average mitochondrial diameter in (G) to (H). n = 47; ***P < 0.001, two-tailed unpaired Student’s t test. (K to N) Toluidine blue staining of the fly thorax thick sections with indicated genotypes. The boxed region was enlarged in the inset to show the detailed defects. In the 35-day-old flies, flight muscle fragments were disorganized (red arrows) in Dhpr17-4 and Pink1[B9] flies. (N) Dhpr genomic fragment (Dhpr G) could rescue the muscle defects in Dhpr17-4 mutant. (K′ to N′) TEM analysis of the thin sections of the fly thorax. The mitochondria in Dhpr17-4 mutant muscles are swollen and have less cristae. (O) Quantification of the ratio of degenerated muscle in (K) to (N). n = 4; **P < 0.01; ***P < 0.001, one-way ANOVA/Bonferroni’s multiple comparisons test. (P) Quantification of the ratio of mitochondria in (K′) to (N′). The diagram on top of this panel shows the typical normal mitochondria (gray) and abnormal mitochondria. The abnormal mitochondria were categorized into three types based on cristae morphology. Type I (blue): Mitochondria lost some cristae, and there are obvious empty spaces between tightly packed cristae. Type II (orange): The cristae of the mitochondria are disorganized and loose. Type III (red): Mitochondria lost most of its cristae, and more than half of the mitochondria area was empty. n = 3 images for each genotype; ***P < 0.001, χ2 (and Fisher’s exact) test. (Q to S) Anti-TH staining (green) of the adult brains from the 35-day-old animals with indicated genotypes. The TH neurons in different brain regions were labeled in (Q). The number of TH neurons in Dhpr and Pink1 mutant animals is significantly reduced in DM, DL1, and PM regions. (T) Quantification of the number of TH neurons from the animals with indicated genotypes. n = 45; ***P < 0.001, one-way ANOVA/Bonferroni’s multiple comparisons test. n.s., not significant. (U to W) The mitochondria become swollen in the TH neurons from the 5-day-old animals when Dhpr were knocked down in TH neurons. Five-day-old Pink1 mutants also had swollen mitochondria in the TH neurons. Mitochondria were labeled by mitoGFP (green). The TH neurons were labeled by anti-TH staining (red). (X) Quantification to show the ratios of cells with enlarged mitochondria per TH neuron cluster. n = 40; ***P < 0.001, one-way ANOVA/Bonferroni’s multiple comparisons test.
