. 2019 Sep 5;8:e50231. doi: 10.7554/eLife.50231

Figure 1. Macrophages release plasma membrane–derived particles onto the substrate during extension and retraction of filopodia and lamellipodia, as judged by correlative live-cell imaging and SEM.

Cells were plated onto poly-D-lysine–coated gridded glass-bottom Petri dishes, and videos were recorded for 24 hr at 5 min intervals (see Figure 1—videos 12). The ‘Live cell’ images show the final frame of the videos. The imaging of cells by SEM made it possible to visualize a lawn of particles that had been released onto the substrate during the projection and retraction of filopodia/lamellipodia. The red boxed region in the live-cell image and in the low-magnification SEM image is shown in the SEM image on the far right. Three independent experiments were performed; representative images are shown. Scale bar, 5 μm.

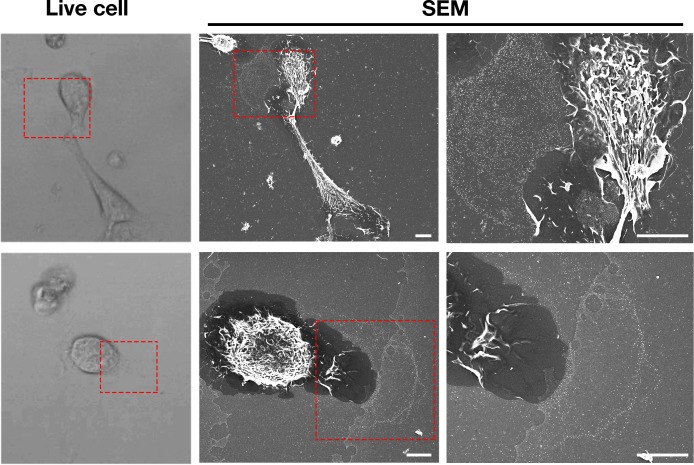
Figure 1.

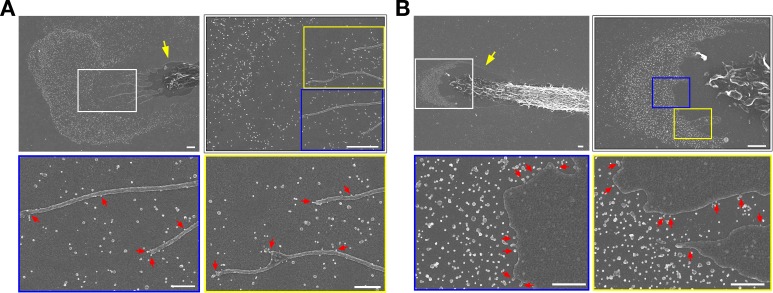
Figure 1—figure supplement 1. Macrophages release particles from the plasma membrane of filopodia and lamellipodia by a process that resembles budding.

Figure 1—figure supplement 1.

(A) Upper left, scanning electron micrograph (SEM) of a mouse peritoneal macrophage (yellow arrow), revealing a lawn of ~30-nm particles on the surrounding substrate. A higher magnification image of the region in the white box is shown in the upper right image, centered on macrophage filopodia. Higher magnification images of the regions in the yellow and blue boxes are shown in the lower two images. (B) Upper left, SEM of a mouse peritoneal macrophage (yellow arrow), revealing a lawn of ~30-nm particles on the surrounding substrate. A higher magnification image of the region in the white box is shown in the image on the upper right, centered on the lamellipodium of the macrophage. Higher magnification images of the regions in the blue and yellow boxes are shown in the images below. For both panels, red arrows show the formation and release of particles from macrophage filopodia and lamellipodia. Three independent experiments were performed; representative images are shown. Scale bar for the top two images, 2 μm. Scale bar for the bottom two images, 500 nm.
Figure 1—video 1. Mouse peritoneal macrophages release vesicular particles onto the surrounding substrate during the extension and retraction of filopodia and lamellipodia.
Download video file (6.1MB, mp4)
DOI: 10.7554/eLife.50231.004
Video shows a macrophage that was imaged by SEM in the top row of Figure 1. Macrophages were plated onto poly-D-lysine–coated gridded glass-bottom Petri dishes, and videos were recorded for 24 h at 5-min intervals. White arrow in videos point to the cell that was visualized by SEM; the red arrow in the videos points to a region of lamellipodia projection/retraction; the white box depicts the region of the cell that was subsequently visualized by scanning electron microscopy (SEM) (see Figure 1).
Video shows a macrophage that was imaged by SEM in the top row of Figure 1. Video shows a 24-h period of live-cell imaging.
Figure 1—video 2. Shows a macrophage imaged by SEM in the bottom row of Figure 1.
Download video file (1.9MB, mp4)
DOI: 10.7554/eLife.50231.005
Video shows the final 15 h of a 24-h period of live-cell imaging.