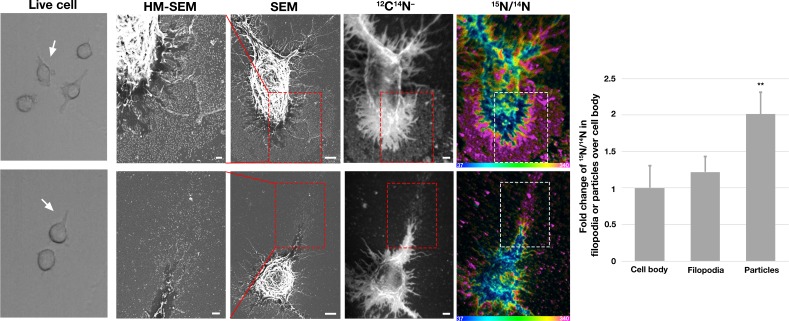
Figure 3. Correlative live-cell, scanning electron microscopy (SEM), and NanoSIMS imaging, revealing that particles released onto the substrate during movement of filopodia and lamellipodia are enriched in accessible cholesterol.
RAW 264.7 macrophages were plated onto iridium- and poly-D-lysine–coated gridded glass-bottom Petri dishes. Videos were recorded for 24 hr at 5 min intervals (see Figure 3—videos 1–2). The ‘Live cell’ images in this figure show the final frame of the videos, with the white arrows pointing to the cells that were subsequently visualized by SEM and NanoSIMS. After live-cell imaging, cells were incubated with [15N]ALO-D4 (a modified cytolysin that binds to ‘accessible cholesterol’). The same cells that were imaged by live-cell imaging were subsequently imaged by SEM (to visualize particles) and NanoSIMS (to visualize [15N]ALO-D4 binding). The particles left behind on the substrate during movement of lamellipodia and filopodia bound [15N]ALO-D4 avidly. 12C14N– NanoSIMS images were used to visualize cell morphology; the 15N/14N images show 15N enrichment (i.e., binding of [15N]ALO-D4). The boxed region in the SEM and NanoSIMS images is shown at higher magnification in the ‘HM-SEM’ image, providing definition of individual particles. 15N enrichment was ~twofold higher in the macrophage particles than on the plasma membrane over the cell body and the filopodia. Two independent experiments were performed; representative images are shown. Quantification of 15N/14N ratios were performed on the cell body and macrophage particles [25 distinct regions of the cell body, filopodia, and particles (20 pixels in diameter) were circled on the 12C14N– image, followed by calculation of 15N/14N ratios in each region]. Images from six macrophages were used for the quantification. Graph shows the mean and standard deviation of the fold change of 15N enrichment in particles and filopodia, normalized to the macrophage cell body. **p<0.001. Scale bar, 2 μm.

