. 2019 Sep 5;8:e50231. doi: 10.7554/eLife.50231

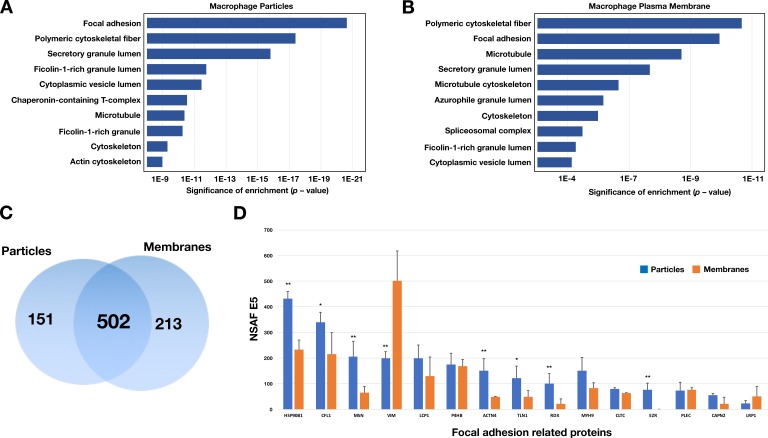
Figure 5. Enrichment in focal adhesion proteins in the particle preparations from RAW 264.7 macrophages.

The most abundant proteins (the top 75th percentile by spectral counts) were analyzed by Enrichr and categorized by GO Cellular Components 2018. (A–B) Analysis of proteins in macrophage particles (n = 653) and macrophage plasma membranes (n = 715) by GO categories. The top 10 cellular component categories were ordered by level of statistical significance. (C) Venn diagram depicting numbers of proteins present in the particle preparation only, the plasma membrane preparation only, or both. (D) Bar graph showing the top 15 focal adhesion–related proteins by the normalized spectral abundance factor (NSAF), multiplied by 10,000. The particle fraction is shown in blue; the plasma membrane fraction is shown in orange. The bar graph shows the mean ± SD for three independent experiments. *p<0.05; **p<0.001.

Figure 5.

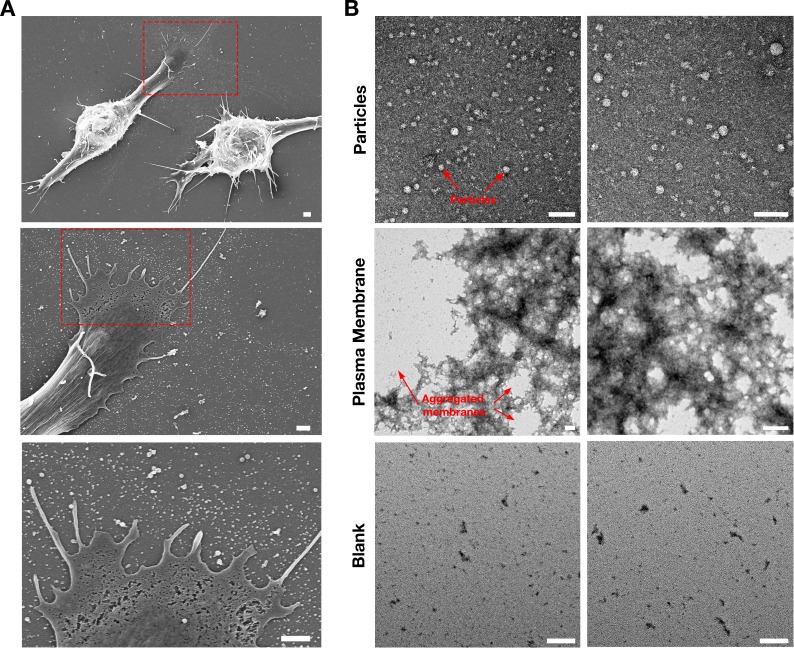
Figure 5—figure supplement 1. Isolation of particles released onto the substrate by RAW 264.7 macrophages.

Figure 5—figure supplement 1.

(A) SEM images of RAW 264.7 macrophages plated onto poly-D-lysine–coated silicon wafers, revealing large numbers of particles on the substrate surrounding the macrophages. Higher magnification images of the red boxed regions are shown in the image below. Scale bar, 1 μm. (B) Negative stained transmission electron micrographs (TEMs) of the particle and plasma membrane preparations from RAW macrophages. Macrophages were plated in tissue culture flasks, and both macrophages and macrophage-derived particles were biotinylated with Sulfo-NHS-SS-biotin. After releasing the cells and the particles from the substrate with 5 mM EDTA, preparations of macrophage particles and plasma membranes were isolated as described in the Materials and methods. Particle and plasma membrane preparations were placed on carbon/formar TEM grids, negatively stained with 2% uranyl acetate, and visualized by TEM. Particles were 20–80-nm in diameter (red arrows). Images of the plasma membrane fractions revealed aggregated membranous material (red arrows). A blank grid, which was also subjected to negative staining, contained no particles or membranes. Three independent experiments were performed; representative images are shown. Scale bar, 100 nm.