. 2019 Sep 5;8:e50231. doi: 10.7554/eLife.50231

Figure 6. Particles released by mouse peritoneal macrophages onto the surrounding substrate are enriched in accessible cholesterol but not sphingomyelin-sequestered cholesterol.

Mouse peritoneal macrophages were plated onto poly-D-lysine–coated glass coverslips and incubated overnight in medium containing 10% FBS and either an FAK inhibitor (CAS 4506-66-5, 2 μM) or vehicle (DMSO) alone. On the next day, the cells were incubated with Alexa Fluor 488–labeled [15N]ALO-D4 (green), which binds to accessible cholesterol, and Atto 647N–labeled [13C]OlyA (red), which binds to sphingomyelin-bound cholesterol (both at 20 μg/ml). Cells were then washed, fixed with 3% PFA, and imaged by STED microscopy. STED images were obtained from the bottom of the macrophage (optical section of ~200 nm). The lawn of particles surrounding macrophages was readily detectable with ALO-D4, but the binding of OlyA to particles was negligible. Two independent experiments were performed; representative images are shown. Scale bar, 5 µm. Higher magnification images of the boxed regions are shown on the right. Scale bar, 2 µm.

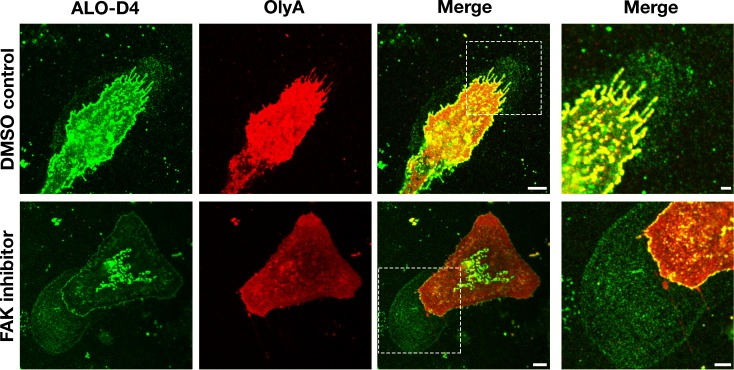
Figure 6.

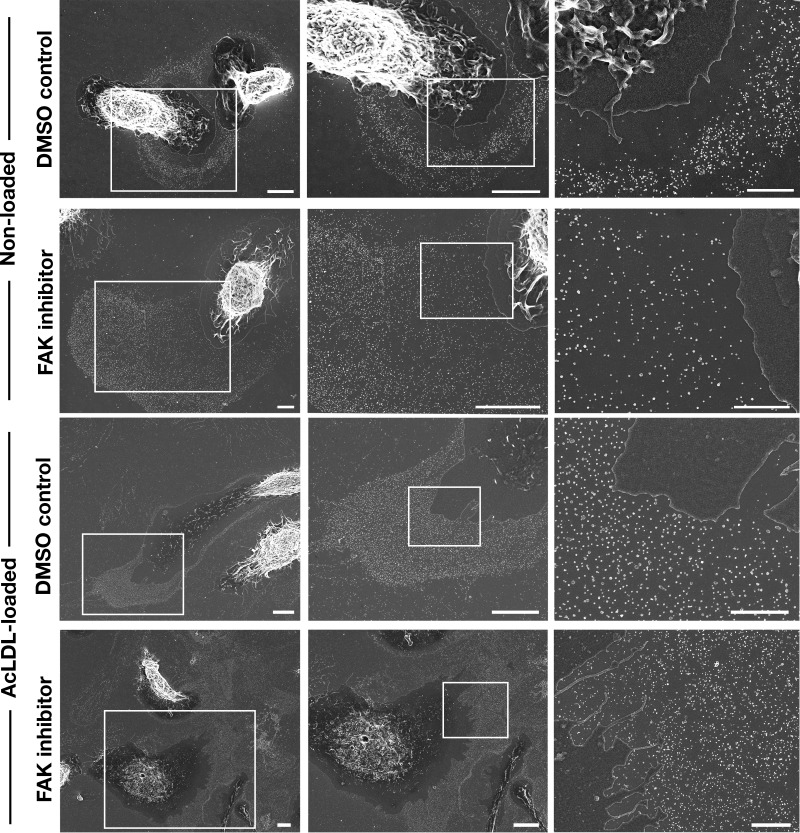
Figure 6—figure supplement 1. Inhibiting focal adhesion kinase in mouse peritoneal macrophages is accompanied by large lawns of particles on the surrounding substrate.

Figure 6—figure supplement 1.

Macrophages were plated onto poly-D-lysine–coated glass-bottom Petri dishes and incubated with a focal adhesion kinase (FAK) inhibitor, 2 μM)] or vehicle (DMSO) alone. In some experiments, macrophages were loaded with acetyl-LDL (AcLDL, 50 μg/ml). The lawn of particles surrounding macrophages was imaged by SEM. Higher magnification images of the white boxed areas are shown on the right. Four independent experiments were performed, with a minimum of 20 cells visualized per experiment. The lawns of particles outside of FAK inhibitor–treated macrophages were ~twice the size of the macrophage cell body, whereas the lawns were only ~40% of the area of the cell body in DMSO-treated macrophages. Scale bars for the images in the left and middle columns, 5 μm. Scale bars for images in the right column, 2 μm.
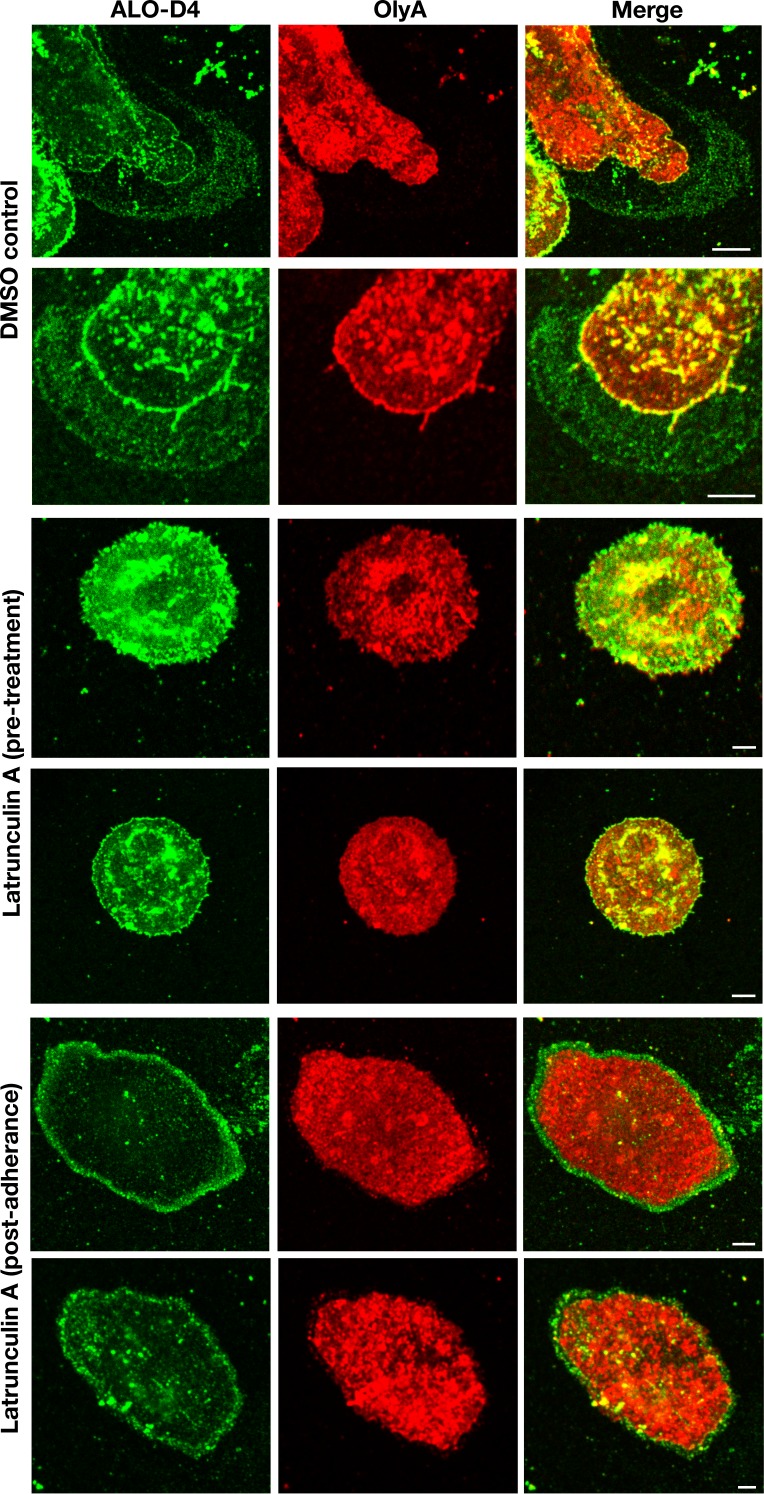
Figure 6—figure supplement 2. Incubating mouse peritoneal macrophages with latrunculin A alters the distribution of ALO-D4 binding.

Figure 6—figure supplement 2.

Macrophages were plated onto poly-D-lysine–coated glass coverslips and incubated with latrunculin A (5 μM) or vehicle alone (DMSO control). The incubation of latrunculin A was initiated either 1 hr prior to plating the cells (‘pre-treatment’) or after the cells had been plated and were adherent to the substrate (‘post-adherence’). On the next day, cells were incubated with Alexa Fluor 488–labeled ALO-D4 and Atto 647N–labeled OlyA (20 μg/ml each). Cells were then fixed with 3% PFA and imaged by STED microscopy. The lawn of particles surrounding macrophages was readily detectable with ALO-D4 but not with OlyA. In post-adherence cells, a circumferential ring of ALO-D4 binding was detected, reflecting ALO-D4 binding to particles released onto the substrate during retraction of the macrophage cell body. Two independent experiments were performed; representative images are shown. Scale bar, 5 μm.
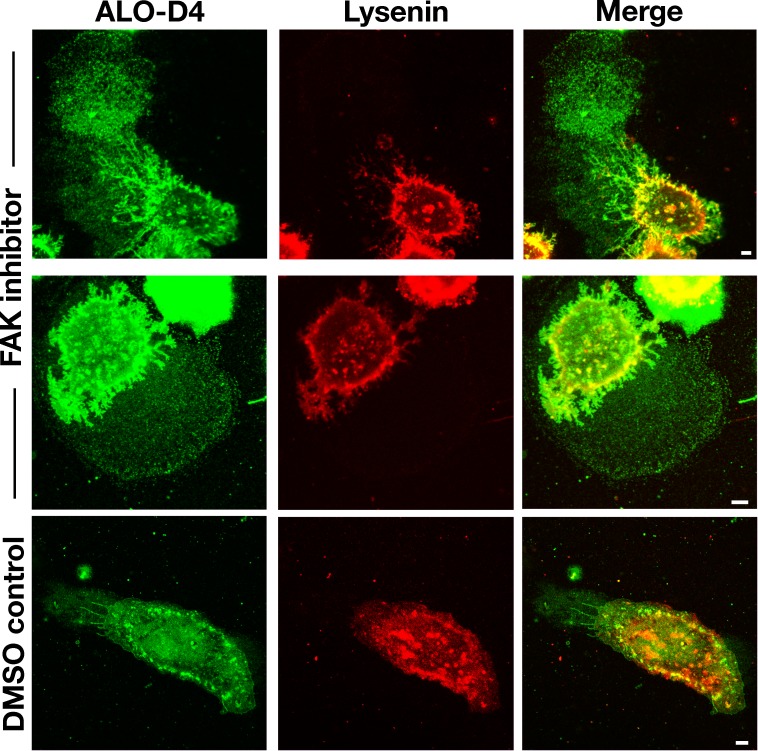
Figure 6—figure supplement 3. Particles released by mouse peritoneal macrophages are enriched in accessible cholesterol but not in sphingomyelin.

Figure 6—figure supplement 3.

Mouse peritoneal macrophages were plated onto poly-D-lysine–coated glass coverslips and incubated overnight in medium containing 10% FBS and either a focal adhesion kinase (FAK) inhibitor (2 μM) or vehicle (DMSO) alone. On the next day, macrophages were incubated with Alexa Fluor 488–labeled [15N]ALO-D4, a marker of accessible cholesterol (green, 20 μg/ml), and a mCherry–lysenin fusion protein, which binds to sphingomyelin (red, 10 μg/ml). Cells were then washed, fixed with 3% PFA, and imaged by STED microscopy. STED images were obtained from the bottom of the macrophage (optical section of ~200 nm). The lawn of particles around macrophages could be detected by ALO-D4 but not by the mCherry–lysenin fusion protein. Two independent experiments were performed; representative images are shown. Scale bar, 5 μm.
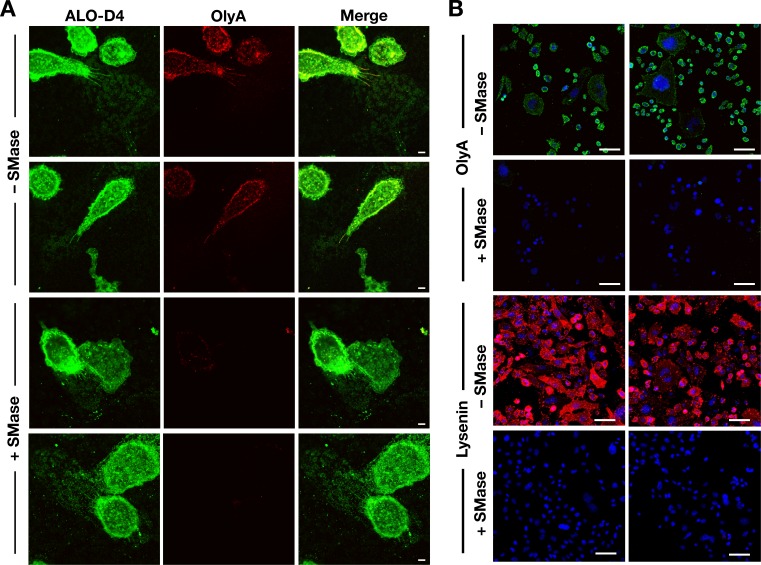
Figure 6—figure supplement 4. Sphingomyelinase treatment reduces OlyA and lysenin binding to the plasma membrane.

Figure 6—figure supplement 4.

(A) Sphingomyelinase markedly reduces OlyA binding to the macrophage plasma membrane. Mouse peritoneal macrophages were plated onto poly-D-lysine–coated glass coverslips and incubated overnight in medium containing 10% FBS. On the next day, cells were incubated for 30 min at 37°C in the presence or absence of sphingomyelinase (SMase) from Staphylococcus aureus (100 milliunits/ml). After washing, cells were incubated with Alexa Fluor 488–labeled ALO-D4, a marker of accessible cholesterol (green, 20 μg/ml), and Atto 647N–labeled OlyA, which detects sphingomyelin-bound cholesterol (red, 20 μg/ml). Scale bar, 5 μm. (B) Sphingomyelinase treatment abolishes OlyA and lysenin binding to CHO-K1 cells. CHO-K1 cells were plated onto poly-D-lysine–coated glass coverslips and incubated overnight in Ham’s F-12 medium containing 10% FBS. On the next day, cells were incubated for 30 min at 37°C in the presence or absence of sphingomyelinase (SMase) (100 milliunits/ml). After washing, the cells were incubated for with Alexa Fluor 488–labeled OlyA, a marker of sphingomyelin-bound cholesterol (green, 20 μg/ml), or with the mCherry–lysenin fusion protein, which binds to sphingomyelin (red, 10 μg/ml). Two independent experiments were performed; representative images are shown. Scale bar, 5 μm.
Figure 6—video 1. Movement of mouse peritoneal macrophages under different experimental conditions.
Download video file (4.4MB, mp4)
DOI: 10.7554/eLife.50231.026
Video shows macrophages treated with vehicle (DMSO) alone. Macrophages were plated onto glass-bottom Petri dishes and incubated in medium containing an FAK inhibitor (2 μM), acetylated LDL (acLDL; 50 μg/ml), acLDL and the FAK inhibitor, or vehicle alone (DMSO). Cells were imaged by live-cell microscopy for 30 h at 5-min intervals. Videos show a 30-h period of live-cell imaging.
Video shows macrophages treated with vehicle (DMSO) alone.
Figure 6—video 2. Shows macrophages treated with an FAK inhibitor.
Download video file (3.4MB, mp4)
DOI: 10.7554/eLife.50231.027
Figure 6—video 3. Shows acLDL-loaded macrophages treated with vehicle (DMSO) alone.
Download video file (6.4MB, mp4)
DOI: 10.7554/eLife.50231.028
Figure 6—video 4. Shows acLDL-loaded macrophages treated with an FAK inhibitor.
Download video file (5.9MB, mp4)
DOI: 10.7554/eLife.50231.029