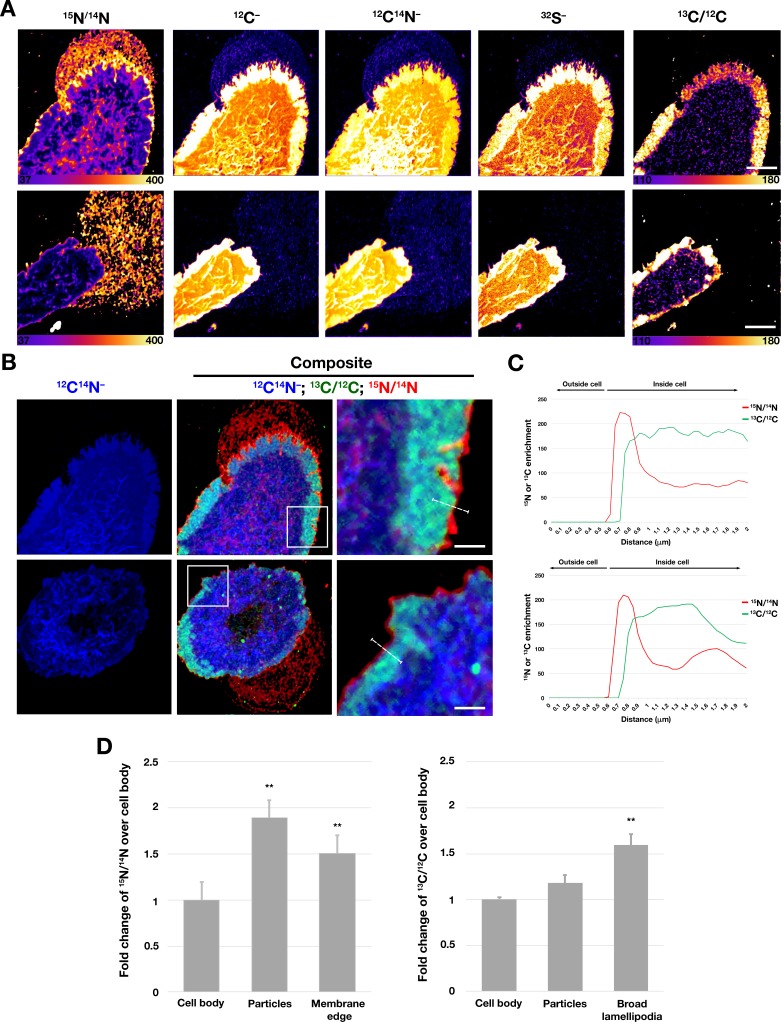
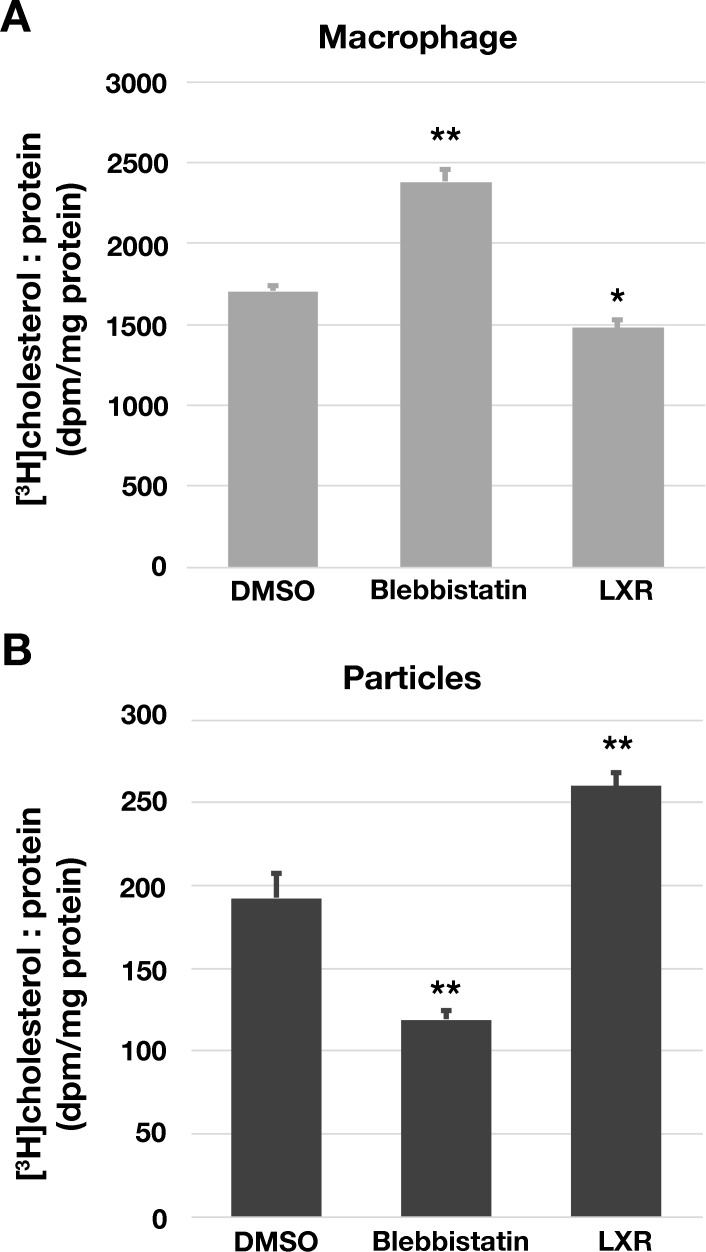
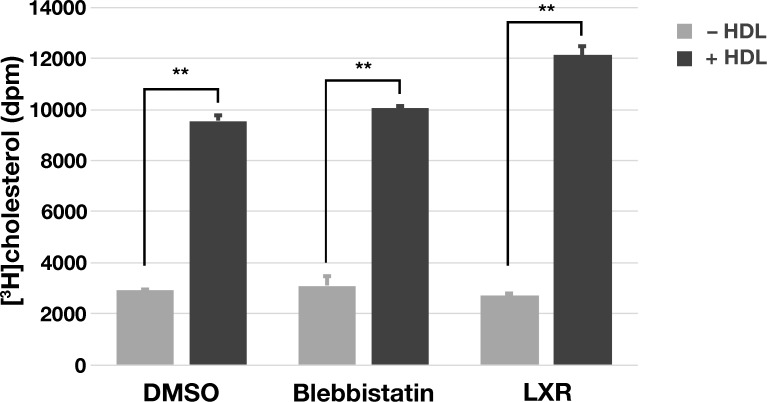
Figure 8. Distribution of distinct pools of cholesterol in the macrophage plasma membrane.
Mouse peritoneal macrophages were plated onto poly-D-lysine–coated MatTek dishes and incubated in medium containing 10% FBS. On the next day, cells were incubated with [15N]ALO-D4 and [13C]OlyA (20 μg/ml each) and then imaged by NanoSIMS. (A) Distributions of [15N]ALO-D4 and [13C]OlyA binding to the plasma membrane. 13C/12C NanoSIMS images revealed a broad band of 13C enrichment near the outer edge of the cell (corresponding to the flat lamellipodia of cells, apparent in the 12C–, 12C14N–, and 32S– NanoSIMS images). The 15N/14N images revealed a thin band of 15N enrichment at the far outer edge of the cells and in the lawn of particles on the surrounding substrate. Additional NanoSIMS images of these cells are shown (with different scales) in Figure 7 and Figure 7—figure supplement 1. (B) Composite 12C14N– (blue), 13C/12C (green), and 15N/14N (red) NanoSIMS images, revealing 15N enrichment at the outer edge of the plasma membrane and in the lawn of particles on the surrounding substrate. Of note, the 15N enrichment at the outer edge of the cell extended beyond the thick band of 13C enrichment. In this figure, the scales for the 13C/12C and 15N/14N NanoSIMS images were adjusted for optimal visualization of the lamellipodia of macrophages. Also, 12C– and 32S– images were included to visualize the lamellipodia. Scale bar, 5 μm. Additional NanoSIMS images of the cell in the top row of this panel are shown in Figure 8A and Figure 7—figure supplement 1; additional NanoSIMS images of the cell in the bottom row of this panel is shown in Figure 7—figure supplement 2. Two independent experiments were performed; representative images are shown. (C) Line scans comparing the 15N/14N and 13C/12C isotope ratios over the outer edge of the plasma membrane (white line in the upper and lower right images of panel B). (D) Quantification, by NanoSIMS, of [15N]ALO-D4 and [13C]OlyA binding to macrophages and to the surrounding particles on the substrate. 15N/14N ratios were quantified for the cell body, macrophage-derived particles, and the thin line of 15N enrichment at the edge of the cell. 13C/12C ratios were quantified for the cell body, macrophage particles, and the broad lamellipodia near the edge of the plasma membrane. For each category, twenty-five regions, 20 pixels in diameter areas were circled on the 12C14N– images, and the 15N/14N and 13C/12C ratios in each circle were calculated. A minimum of six macrophage images were used. Graph shows the mean and standard deviation of the fold change of 15N or 13C enrichment, normalized to the macrophage cell body. **p<0.001.


