Figure 4.
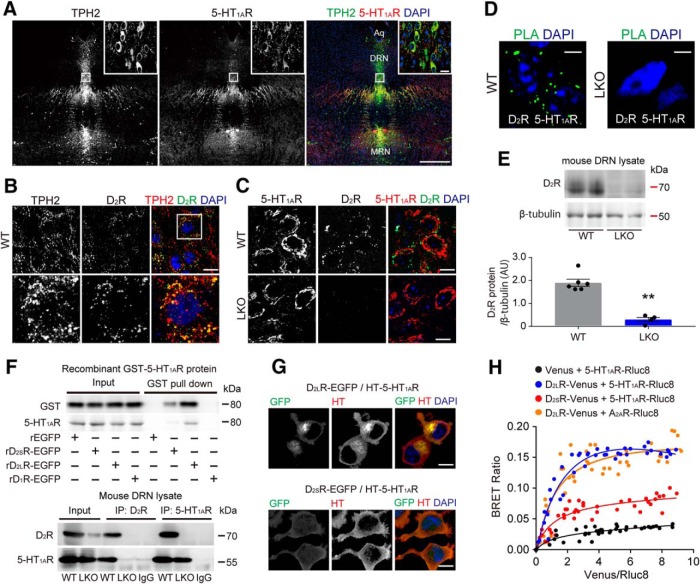
D2LR protein directly binds 5-HT1AR and colocalizes with it in serotonergic neurons. A–C, Confocal images showing the localization of D2R and TPH2 or 5-HT1AR in the DRN. TPH2 and 5-HT1AR immunoreactivities almost completely merge. MRN, Medial raphe nucleus; Aq, aqueduct. Scale bar, 400 μm. A, D2R colocalizes with both TPH2 (B) and 5-HT1AR (C) in the DRN. D2R immunoreactivity is not detected in the D2R-KO DRN samples (C, bottom). Boxed panels are high-magnification images of images in the white rectangles. Blue, DAPI. Scale bars, 10 μm. D, D2R association with 5-HT1AR as assessed by dual-recognition PLA. Signals indicative of the D2R/5-HT1AR interaction are clearly seen in the WT DRN sections (left). D2R/5-HT1AR interaction is undetectable in the D2LR-KO DRN sections (right). PLA was repeated three times and representative data are shown. Blue, DAPI. Scale bars, 5 μm. E, Top, Representative immunoblot of mouse DRN lysates probed with the indicated antibodies. Bottom, Densitometric analysis of D2R levels normalized to β-tubulin (A.U., arbitrary units). WT, n = 6 mice; D2LR-KO, n = 4 mice. Each bar represents the mean ± SEM. **p < 0.01 by two tailed unpaired t test (t = 7.628, DF = 8, p < 0.0001). F, Top, GST pull-down samples with purified recombinant (r)EGFP, EGFP-tagged rD2R isoforms, or EGFP-tagged rD1R with recombinant GST-5-HT1AR protein immunoblotted with GST antibody. Pull-down assay was repeated two times and representative data are shown. Bottom, Mouse DRN lysates were immunoprecipitated (IP) with the indicated antibodies and Western blots were probed with the indicated antibodies. G, Confocal images showing colocalization of EGFP-tagged D2R isoforms with Halo-tagged 5-HT1AR. Blue, DAPI. Scale bars, 10 μm. H, BRET saturation curves for the indicated receptor complexes. The fluorescence signal from Venus normalized to the luminescence of Rluc8 is shown on the x-axis. Each bar represents the mean ± SEM.

