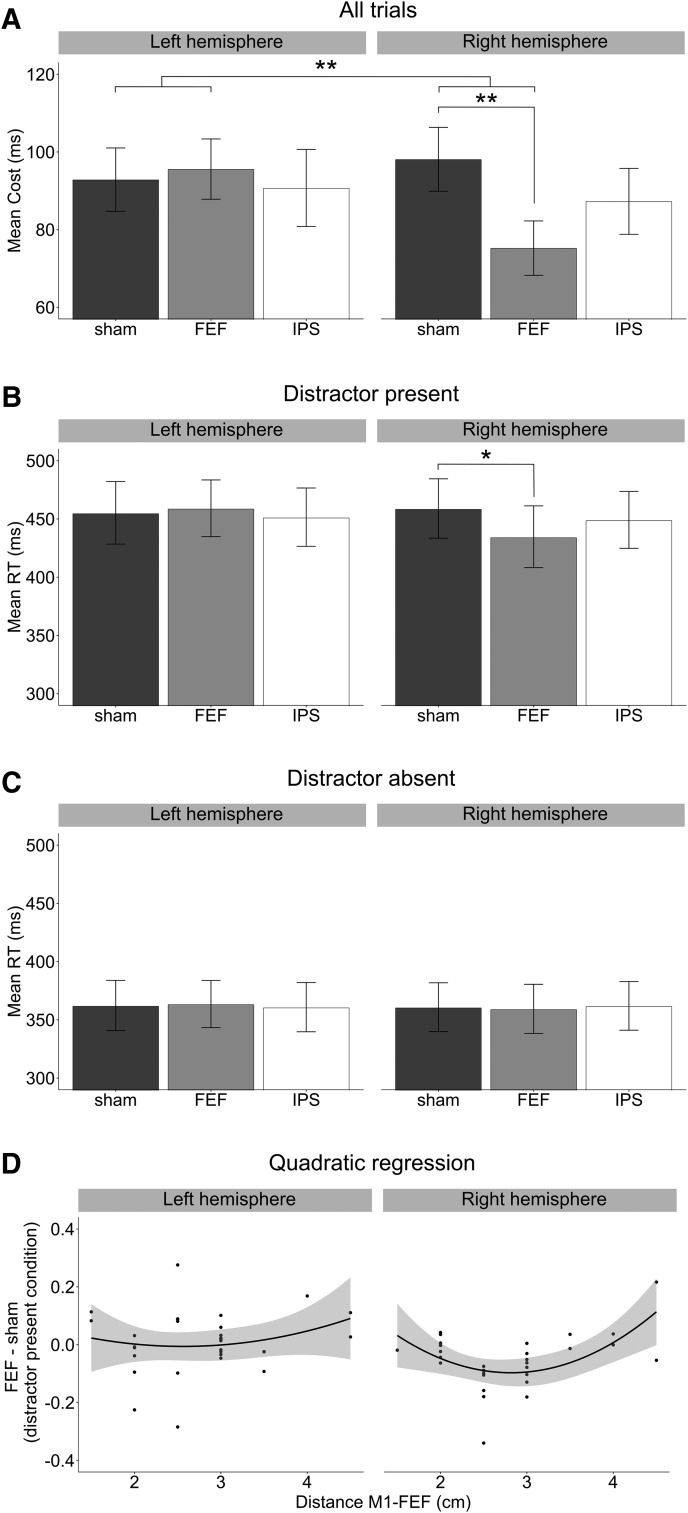
Figure 3.
TMS effects on visual search. A, Difference RTs for trials in which there was a singleton distractor relative to trials in which it was absent (distractor cost), shown as a function of the TMS site (sham, FEF, and IPS) and brain hemisphere (left, right). The effect of right FEF stimulation was significantly different relative to left FEF stimulation. The distractor cost was significantly reduced after right FEF stimulation compared with its correspondent sham control condition. Error bars indicate SEM. **p < 0.01. B, Mean RTs for the distractor-present condition, as a function of TMS site and brain hemisphere. Error bars indicate SEM. *p < 0.05 (Bonferroni-Holm–corrected). TMS over right FEF significantly reduced RTs compared with the corresponding right sham control condition. C, Mean RTs for the distractor-absent condition, as a function of TMS site and brain hemisphere. Error bars indicate SEM. D, Quadratic regression predicting the magnitude of the significant effect (i.e., RT difference between FEF and sham in the distractor-present condition) after the distance between putative FEF and M1 in individual participants, separately for each hemisphere. The effect of TMS was the strongest when the distance between right putative FEF and right M1 was ∼2.77 cm. Shaded area represents the 95% CI of the best-fit line.

