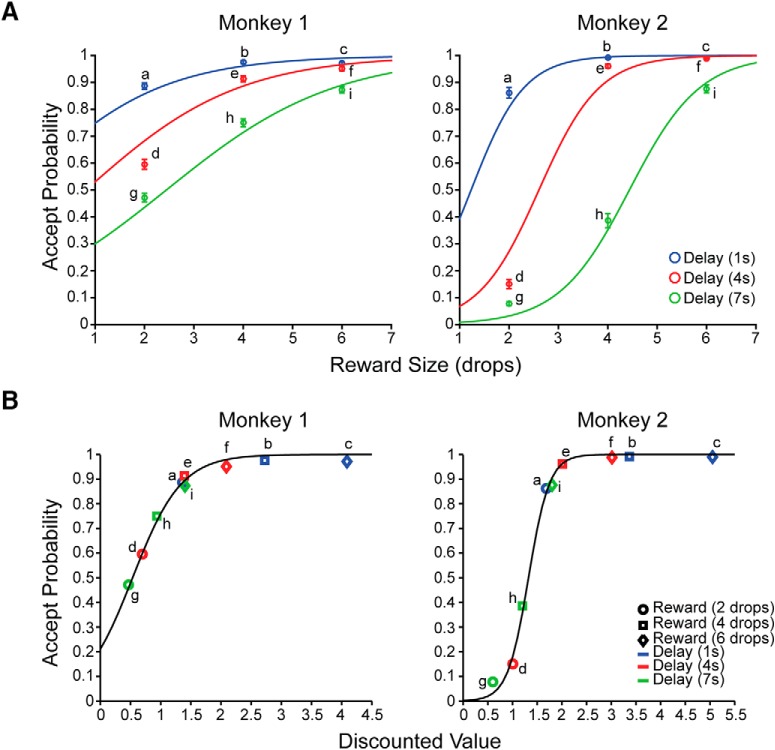
Figure 2.
Behavioral performance. A, Mean accept probabilities (±SEM) as a function of reward size (drops), and delay to reward. The colored lines indicate the best fits using a logistic regression model with reward size and delay as independent variables and accept rate as the dependent variable. The probability of accepting the offer is highest for the largest reward with the shortest delay and becomes progressively smaller as the reward size becomes smaller and/or the delay becomes longer. B, Accept probability (colored points) estimated from hyperbolic discounting for Monkey 1 and exponential discounting for Monkey 2 (see Results). The black curves show accept probability fit using a sigmoidal function (see Results). Letters from “a” to “i” indicate the nine possible offers.

