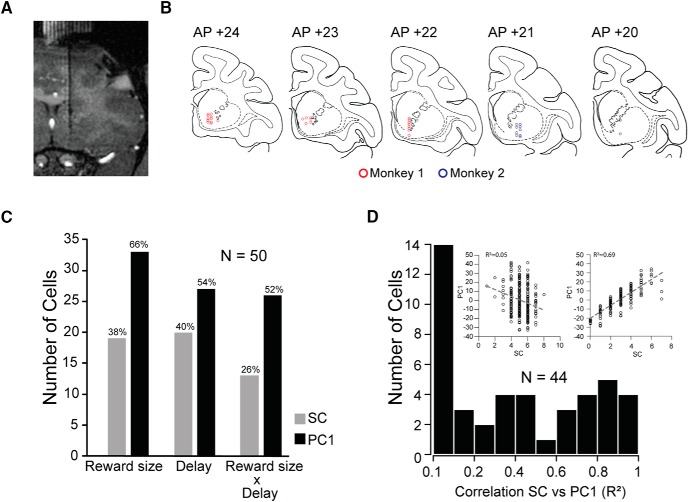
Figure 3.
Recording sites and number of cells modulated by the main factors. A, Frontal T1-weighted MR scan with one electrode in place, in one monkey. B, Locations of recorded TANs (red dots, Monkey 1; blue dots, Monkey 2), reconstructed based on MRI and reported on the Rhesus Macaque “RED” Symmetrical Brain Atlas (Saunders and Phil, 2006). C, Cells modulated by reward size and/or delay in the cue period using spike count (gray bars) or the coefficient of PC1 (black bars) as dependent variable in the two-way ANOVA. D, Distribution of the linear correlation coefficients between spike count (SC) and the coefficient of the PC1 of the significant cells from the two-way ANOVA. Left inset, Scatter plot between SC and PC1 for one cell with low correlation (R2) between SC and PC1. Right inset, Scatter plot between SC and PC1 for one cell with high correlation (R2) between SC and PC1.

