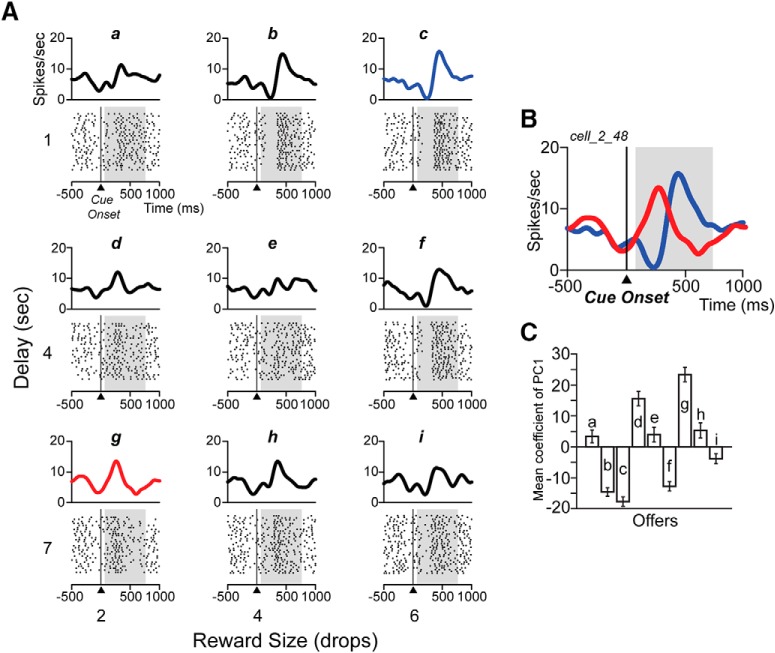
Figure 4.
Spike raster plots for one sinusoidal neuron. A, Raster displays from one neuron for the nine offers (indicated from “a” to “i” and related to Fig. 1B), aligned to cue onset (time 0). The spike density is shown above each raster. Shading shows the 75–750 ms analysis interval. B, Spike density curves of two offers (largest value, 6 drops/1 s delay, blue curve; top right in A, and smallest value, 2 drops/7 s delay, red curve; bottom left in A), illustrating the inversion of the pause-pulse phase according to reward value. C, Mean coefficient of PC1 (±SE) for each of nine offers (indicated from “a” to “i”) for the neuron in A.

