Figure 5.
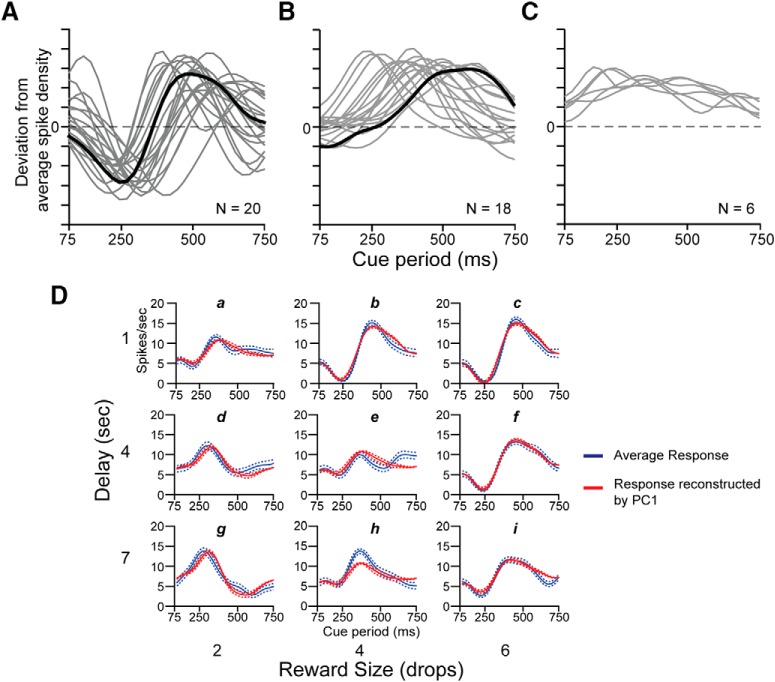
First principal component by shape. A, Sinusoidal first principal components for 20 neurons showing reversed pause-pulse response among offers (gray and black curves). The black curve corresponds to the sinusoidal shape of the first principal component of the neuron in Figure 4A. The two peaks, one positive and the other negative for PC1, show that the most variance in the overall response is localized in two periods of the cue period. In the neural response of the neuron in Figure 4A, these two periods roughly coincide with those where the pause becomes pulse or vice versa and the pulse became pause or vice versa (shown in detail in Fig. 4B). B, Unimodal first principal component for 18 neurons (gray and black curves). The black curve corresponds to unimodal shape of the first principal component of the neuron in Figure 6A. This curve shows that the variance across the overall response is mostly localized in one period of the whole cue period. This period roughly coincides with the starting of the pulse phase of the neural response and with the starting of the variability of the response among the offers (shown in detail in Fig. 6B). C, First principal component for six neurons with sustained firing (gray curves). D, Average response (blue line) and average response reconstructed by adding PC1 weighted by coefficient of PC1 to the average response (red line) for the neuron in Figure 4A, for each offer (indicated from “a” to “i”). Dashed lines represent SE.

