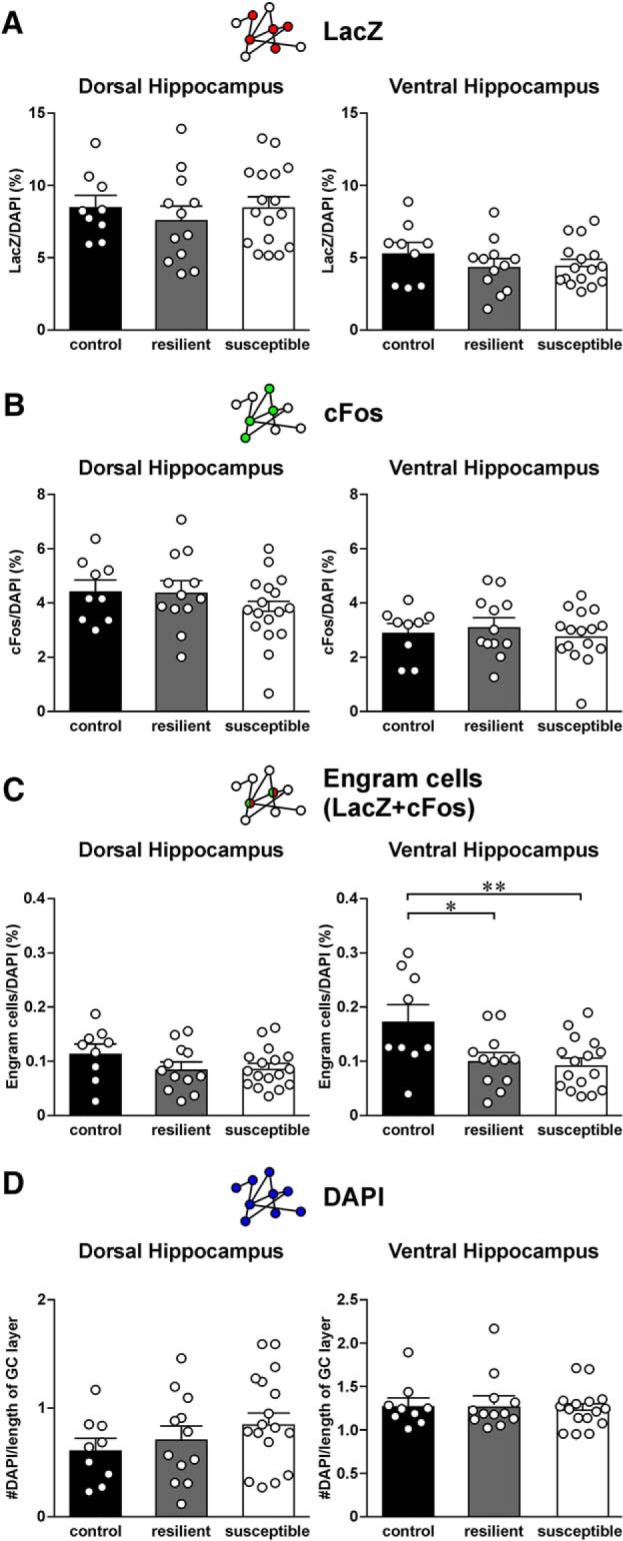
Figure 8.

Expression of LacZ, cFos, and engram cells in the dentate gyrus (DG) region of the dorsal and ventral hippocampus of control, resilient, and susceptible mice. A, Histograms represent the density of LacZ cells in the DG region of dorsal (left) and ventral hippocampus (right) of control (n = 9), resilient (n = 12), and susceptible mice (n = 17). Mean ± SEM. B, Histograms represent the density of cFos cells in the DG region of dorsal (left) and ventral hippocampus (right) of control, resilient, and susceptible mice. Mean ± SEM. C, Histograms represent the density of engram cells (double-labeled for both LacZ and cFos) in the DG region of dorsal (left) and ventral hippocampus (right) of control, resilient, and susceptible mice. Tukey's test after ANOVA: *p < 0.05; **p < 0.01. Mean ± SEM. D, Histograms represent the density of DAPI-stained cells in the DG region of dorsal (left) and ventral hippocampus (right) of control, resilient, and susceptible mice. Mean ± SEM.
