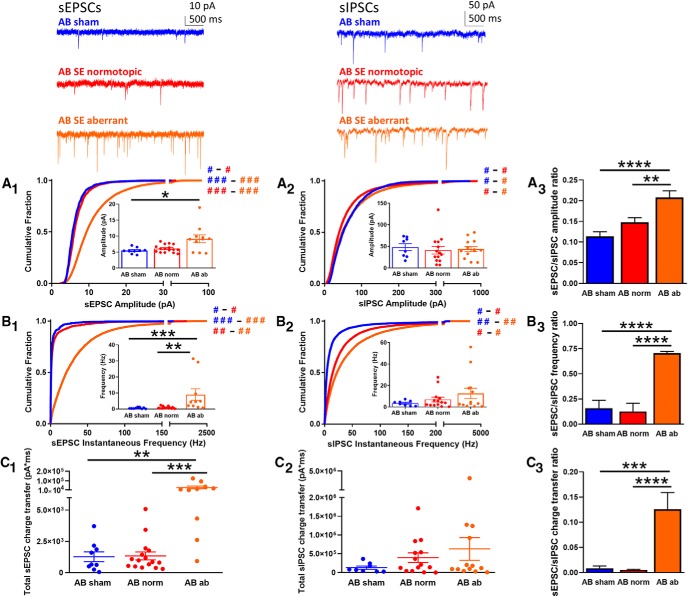
Figure 3.
sEPSCs and sIPSCs recorded from AB DGCs. Top insets, Representative traces are shown for sEPSCs (top left) and sIPSCs (top right) from AB DGCs in sham (blue) and AB normotopic (red) or aberrant (orange) DGCs in SE-treated rats. A, Cumulative histogram shows the amplitude of sEPSCs (A1) and sIPSCs (A2) recorded from DGCs in the AB sham (blue), SE normotopic (norm, red), and SE aberrant (orange) groups. Insets show the median amplitude from each cell recorded in that group. A3, The ratio of the sEPSC-to-sIPSC amplitude was calculated using the average of the median amplitude from each cell recorded in each group; error was propagated mathematically from the variance of individual recordings. B, Cumulative histogram of sEPSC (B1) and sIPSC (B2) instantaneous frequency recorded from DGCs in the AB sham (blue), SE normotopic (red), and SE aberrant (orange) groups. Insets show the median instantaneous frequency from each cell recorded in that group. B3, The ratio of the sEPSC-to-sIPSC instantaneous frequency was calculated using the average of the median amplitude from each cell recorded in each group; error was propagated mathematically from the variance of individual recordings. C, Total charge transfer, calculated as the sum of the charge transfer for each individual event over the entire 5-min recording period, is shown for each cell from each group for sEPSCs (C1) and sIPSCs (C2). C3, The ratio of the sEPSC-to-sIPSC total charge transfer was calculated using the average of the cells recorded in each group; error is SEM. Hash signs in A1, A2 and B1, B2 denote Cohen's d effect size by group comparison (color) and magnitude (# = negligible/minimal; ## = moderate; ### = major). Asterisks denote statistical significance: *p < 0.05, **p < 0.01, ***p < 0.001, ****p < 0.0001.

