Figure 1.
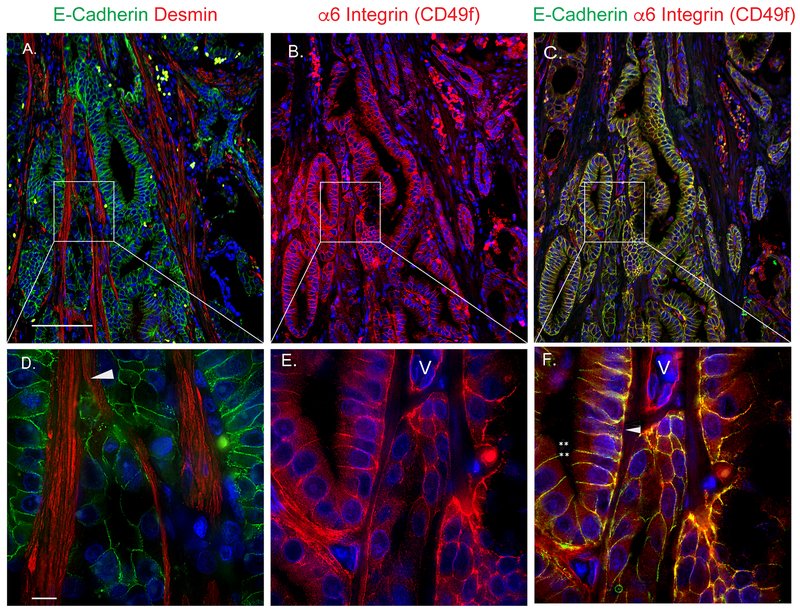
Muscle invasive networks in human PCa express α6 integrin and E-cadherin. The same tissue section was stained for E-cadherin and desmin (Fig.1A) or α6 integrin alone (Fig.1B) or E-cadherin and α6 integrin (Fig.1C). Higher power images of same areas were collected for E-cadherin and desmin (Fig.1D) or α6 integrin alone (Fig.1E) or E-cadherin and α6 integrin (Fig.1F). Human PCa within radical prostatectomy de-identified specimens (A, D) was stained for E-cadherin (green), muscle (desmin, red) and nuclei (DNA, blue) or in (B, E) for α6 integrin (red) and nuclei (DNA, blue) or in (C, F) for E-cadherin (green), α6 integrin (red) and nuclei (DNA, blue). Tumor was invading between the smooth muscle (white arrow, D) between the muscle fibers and α6 integrin expressing vessel (V, E) was present as expected. Scale bar is 100 microns. Boxed areas in A-C are expanded in D-F with scale bar of 10 microns. Areas of α6 integrin and E-cadherin co-distribution in F (yellow), areas of cadherin only (green,**) and α6 integrin only (red, white triangle) were observed. Results are representative of at least 3 biological replicates (n=3) using either needle biopsy or radical prostatectomy de-identified specimens.

