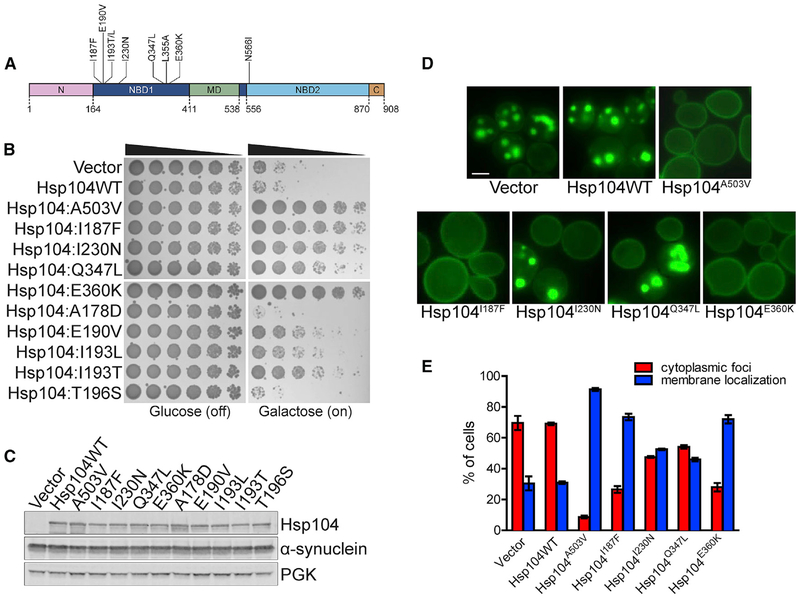
Figure 1. Hsp104 NBD1 Variants Suppress α-syn Toxicity, Aggregation, and Mislocalization.
(A) Domain map of Hsp104 shows the location of potentiating mutations in NBD1 (dark blue) and NBD2 (light blue). A503V is in the MD (green). Pink, NTD; brown, CTD.
(B) NBD1 variants suppress α-syn toxicity in yeast. W303aΔhsp104-pAG-303GAL-α-syn-YFP-304GALα-syn-YFP yeast were transformed with Hsp104 variants or vector. Strains were serially diluted 5-fold and spotted in duplicate onto glucose (non-inducing) and galactose (inducing) media.
(C) NBD1 variants do not reduce α-syn expression in yeast. Strains in (B) were induced for 8 h, lysed, and immunoblotted for Hsp104, α-syn, and 3-phosphoglycerate kinase (PGK; loading control).
(D) NBD1 variants suppress α-syn aggregation and mislocalization in yeast. Selected strains in (B) were induced for 8 h and prepared for fluorescence microscopy. Scale bar, 2.5 μm.
(E) α-syn aggregation and localization were quantified by calculating the proportion of cells exhibiting either cytoplasmic aggregates or plasma membrane localization. Values represent means ± SEM (n = 3).
See also Figures S1 and S2.

