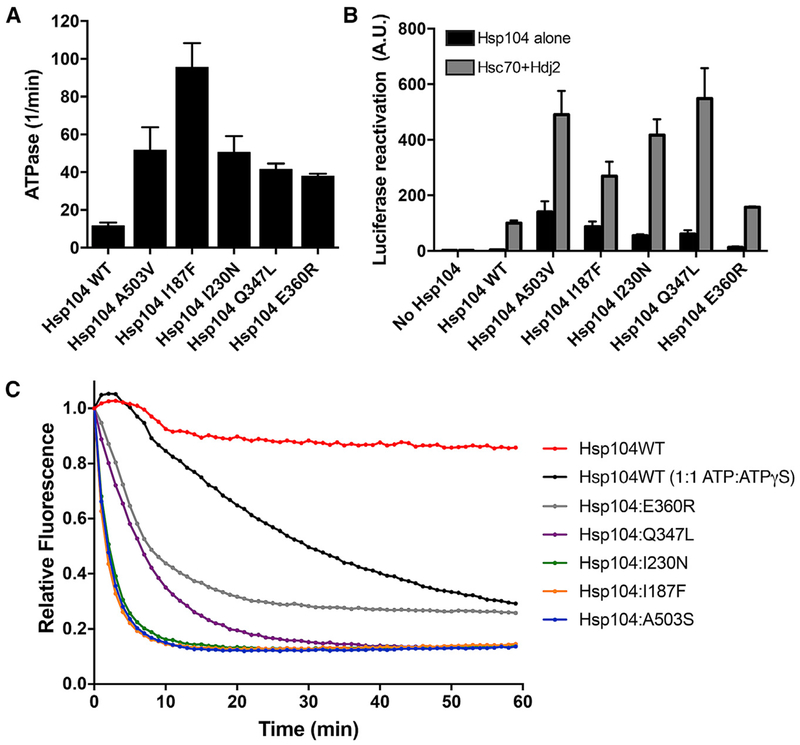
Figure 6. Potentiated NBD1 Variants Display Enhanced ATPase, Disaggregase, and Unfoldase Activity.
(A) NBD1 variants exhibit elevated ATPase activity. Values represent means ± SEM (n = 2–3).
(B) NBD1 variants exhibit elevated disaggregase activity. Luciferase aggregates were incubated with Hsp104 variant plus (gray bars) or minus (black bars) Hsc70 (0.167 μM) and Hdj2 (0.167 μM). Values represent means ± SEM (n = 2–7).
(C) NBD1 variants exhibit elevated unfoldase activity. RepA1–70-GFP was incubated with Hsp104 variant and GroELtrap plus ATP or ATP:ATPγS (1:1). GFP unfolding was measured by fluorescence. Representative data from three trials are shown.
See also Figures S4.

