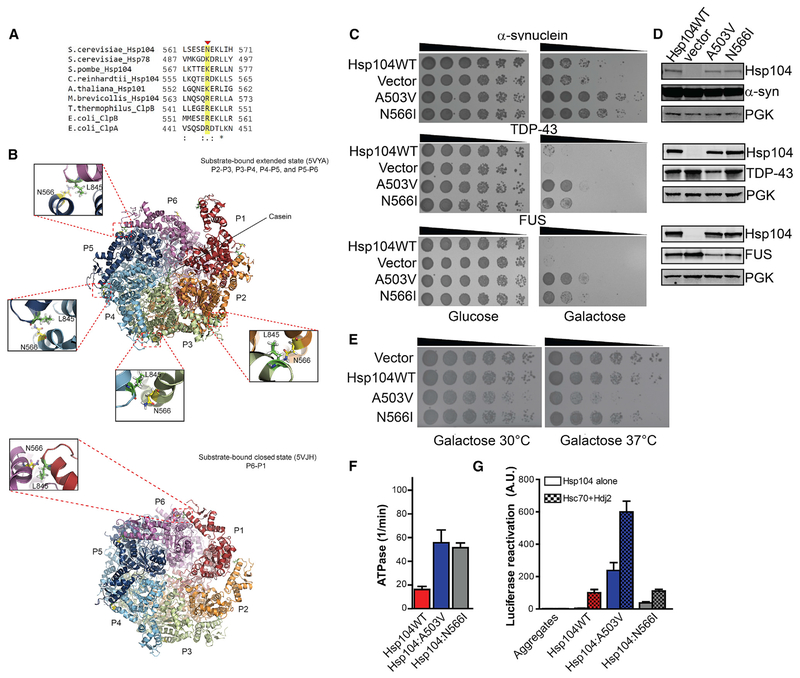
Figure 7. Hsp104N566I Is a Potentiated NBD2 Variant.
(A) Clustal Omega (Sievers and Higgins, 2018) alignment of a portion (residues 561–571) of NBD2 from S. cerevisiae Hsp104 with S. cerevisiae Hsp78, S. pombe Hsp104, C. reinhardtii Hsp104, A. thaliana Hsp101, M. brevicollis Hsp104, T. thermophilus ClpB, E. coli ClpB, and E. coli ClpA. N566 is indicated with a red arrowhead and highlighted in yellow. Asterisk denotes fully conserved residue, colon denotes conservation of residues with strong similarity, and period indicates conservation of residues with weak similarity.
(B) Bottom-up view of Hsp104 hexamers bound to ATPγS and casein in the extended state (top panel; PDB: 5VYA) or closed state (bottom panel; PDB: 5VJH). Protomer 1 (P1) is shown in red, P2 in orange, P3 in green, P4 in cyan, P5 in blue, and P6 in purple. N566I lies in close proximityto L845 in the neighboring subunit at the P2-P3, P3-P4, P4-P5, and P5-P6 subunit interfaces in the extended state bound to casein (top panel). In contrast, N566I lies in close proximity to L845 in the neighboring subunit at the P6-P1 interface in the closed state (bottom panel).
(C) Hsp104N566I rescues α-syn, FUS, and TDP-43 toxicity in yeast. W303aΔhsp104 yeast were transformed with α-syn, FUS, orTDP-43 and Hsp104 variants or vector. Strains were serially diluted 5-fold and spotted in duplicate onto glucose (non-inducing) and galactose (inducing) media.
(D) Hsp104N566I does not grossly reduce α-syn, FUS, or TDP-43 expression in yeast. Strains in (A) were induced for 5 h (FUS and TDP-43) or 8h (α-syn), lysed, and immunoblotted. PGK serves as a loading control.
(E) Hsp104N566I does not exhibit reduced growth at 37°C. Hsp104 variants were expressed in the 416GAL vector in W303aΔhsp104 yeast in the absence of any disease protein. Strains were serially diluted 5-fold and spotted onto galactose (inducing) media and analyzed at 30°C or 37°C.
(F) Hsp104N566I exhibits elevated ATPase activity. Values represent means ± SEM (n = 3).
(G) Hsp104N566I exhibits elevated disaggregase activity in the absence of Hsp70 and Hsp40. Luciferase aggregates were incubated with Hsp104 variant plus (checkered bars) or minus (clear bars) Hsc70 (0.167 μM) and Hdj2 (0.167 μM). Values represent means ± SEM (n = 3).
See also Figures S5–S7.

