Fig. 1.

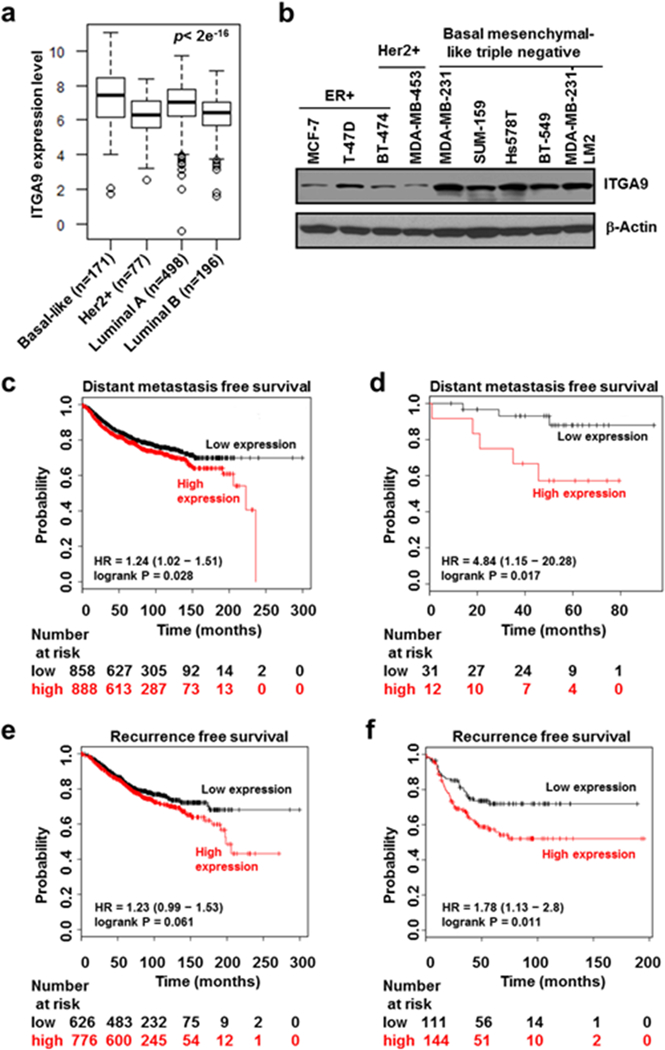
ITGA9 expression level is significantly higher in TNBC than other breast cancer subtypes and high ITGA9 expression level is associated with significantly worse DMFS and RFS in TNBC patients. a ITGA9 expression level analysis among different breast cancer subtypes. The patient gene expression data was retrieved from TCGA PanCancer Atlas Breast Invasive Carcinoma dataset (http://www.cbioportal.org/index.do) and log2 transformed. The differences among groups were determined by one way ANOVA. b Representative images of Western blot analysis of ITGA9 protein level among different type of breast cancer cells. c, d DMFS analysis. The KM plotter (http://kmplot.com/analysis/) was used to analyze the relationship between ITGA9 expression level and DMFS for all breast cancer subtypes (c) or TNBC subtype (d). e, f RFS analysis. The KM plotter was used to analyze the relationship between ITGA9 expression level and RFS for all breast cancer subtypes (e) or TNBC subtype (f).
