Fig. 2.

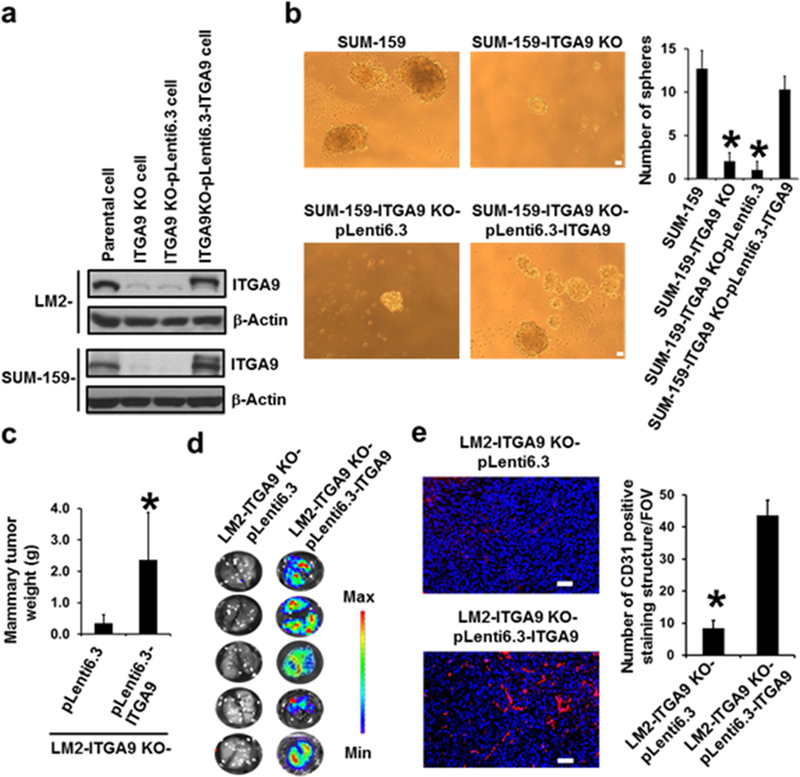
ITGA9 KO by CRISPR/Cas9 significantly reduces TNBC cell CSC-like property, tumor angiogenesis, tumor growth and metastasis. a Representative images of Western blot analysis of ITGA9 level in parental, ITGA9 KO and ITGA9 re-expressing TNBC cells. b Representative images of suspension mammary spheres and quantifications. The numbers of spheres formed in each group were counted and presented as mean ± SD (n=3). *p< 0.05, compared to parental SUM-159 cells or ITGA9 re-expressing ITGA9 KO cells. Scale bar, 50 μm. c Mouse mammary xenograft tumor weight (mean ± SD, n=5). d Images of mouse lung ex vivo IVIS bioluminescence imaging analysis. e Representative overlaid images of IF staining of CD31 (red) and nuclear DNA DAPI (blue) and quantifications of CD31 positive staining in mouse mammary xenograft tumors. The CD31 positive staining were counted and presented as numbers of CD31 positive staining structures per field of view (FOV) (mean ± SD, n=30). *p<0.05. Scale bar, 50 μm.
