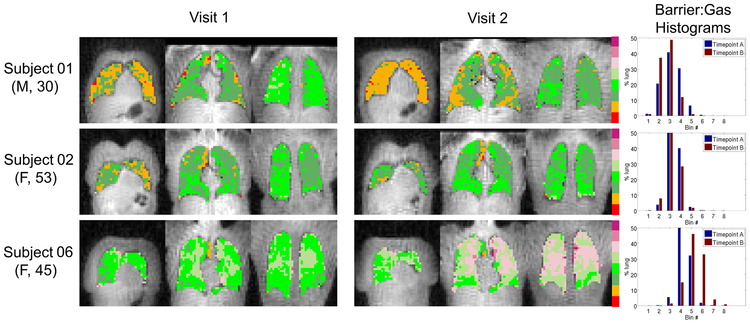
Figure 3.
Parametric maps of Barrier:Gas (binned according to a reference distribution mean and standard deviation) in coronal slices from 3 different subjects at both visits. Lung volumes were approximately +14%, +4% and −18% different at visit 2 for subjects 01, 02 and 06, respectively. Smaller visit 2 lung volumes (e.g. Subject 06) were associated with higher visit 2 Barrier:Gas, and vice versa (e.g. Subject 01). Spatial distributions of regions of relatively high and low Barrier:Gas appear relatively well matched between visits. Subject numbers correspond to those in Table 1. Numerical cutoff values between Barrier:Gas bins (from smallest to largest) were [0.26, 0.64, 1.03, 1.42, 1.81, 2.20, 2.58].

