Figure 3.
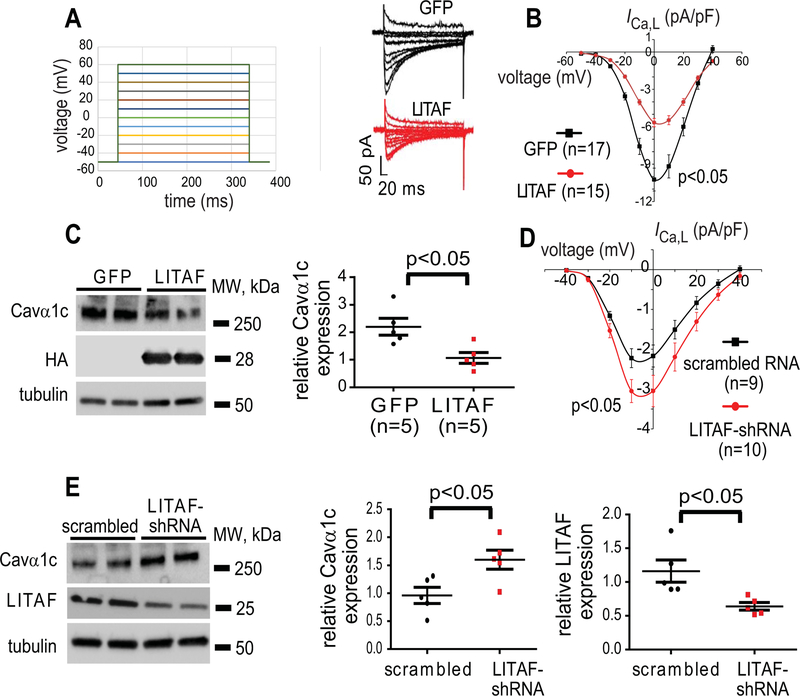
Control of ICa,L current and Cavα1c protein levels by LITAF in 3-week-old cardiomyocytes. Cardiomyocytes were transduced with adenovirus encoding GFP or HA-LITAF for 48 h. A, Left panel: voltage steps to measure I-V for ICa,L. Right panel: representative recordings of ICa,L in cardiomyocytes. B, Voltage dependence of ICa,L current density in cardiomyocytes transduced with GFP or LITAF (cells from 5 animals; mean±SEM; Student’s t-test, p<0.05). C, Protein levels of Cavα1c, HA-LITAF, and tubulin (left panel). Respective change in Cavα1c abundance, normalized to tubulin (n=5 animals, performed in triplicate; mean±SEM). Student’s t-test, p<0.05 (right panel). D, Mean current-voltage relationships of ICa,L peak currents for baseline conditions from cells expressing scrambled RNA or shRNA against endogenous LITAF (cells from 5 animals; mean±SEM; Student’s t-test, p<0.05). E, Protein levels of Cavα1c, total LITAF, and tubulin (left panel). Respective changes in Cavα1c and LITAF abundance, normalized to tubulin (n=5 animals, performed in triplicate) (right panel).

