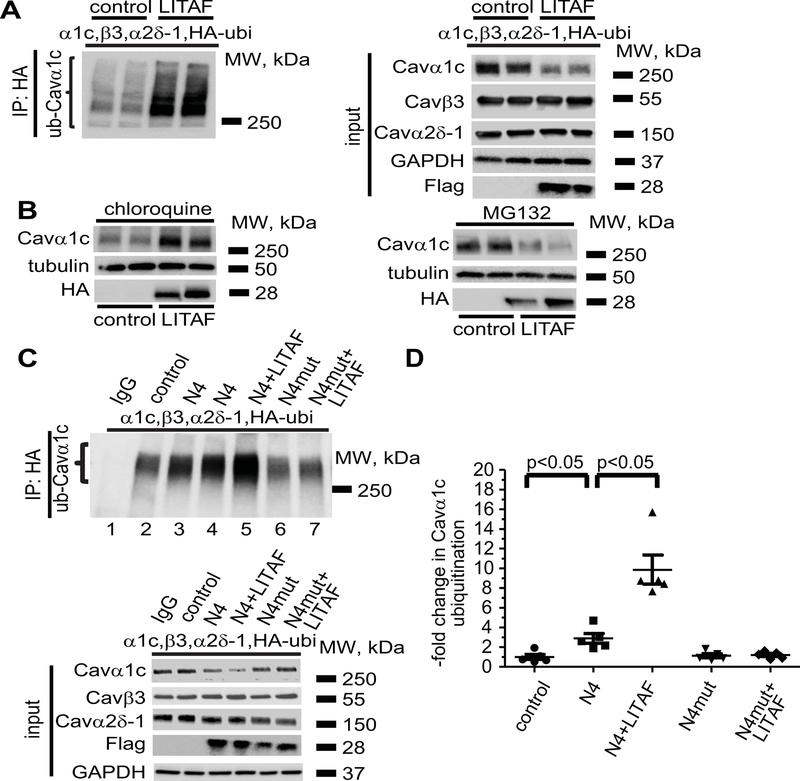
Figure 6.
LITAF-mediated ubiquitination and degradation of Cavα1c in tsA201 cells. Cells were transfected with plasmids for Cavα1c, Cavβ3, and Cavα2δ−1, HA-tagged ubiquitin, GFP as control, or Flag-tagged LITAF. Immunoprecipitation (IP) of lysates from transfected cells was performed with anti-HA antibody. A, A representative immunoblot shows levels of ubiquitinated Cavα1c (left panel) and input levels of Cavα1c, Cavβ3, Cavα2δ−1, Flag-tagged LITAF, and GAPDH (right panel). B, LITAF-mediated degradation of Cavα1c through lysosomes. Cells were transfected with plasmids for Cavα1c, Cavβ3, and Cavα2δ−1, GFP as control, or HA-tagged LITAF for 24 h and then treated with 10 μM chloroquine or 5 μM MG132 for 20 h. Representative western blots show total abundance of Cavα1c and tubulin of treated cells. C, Immunoprecipitation (IP) of lysates from cells transfected with plasmids for Cavα1c, Cavβ3, and Cavα2δ−1, HA-tagged ubiquitin, GFP as control, NEDD4-1, NEDD4-1-C867A, and/or Flag-tagged LITAF was performed with anti-HA antiserum. A representative immunoblot shows levels of ubiquitinated Cavα1c (top panel) and input levels of Cavα1c, Cavβ3, Cavα2δ−1, Flag-tagged LITAF, and GAPDH (bottom panel). D, Respective changes in the level of ubiquitinated Cavα1c, normalized to total Cavα1c (five experiments, performed in duplicate; mean±SEM). Student’s t-test, p<0.05.

