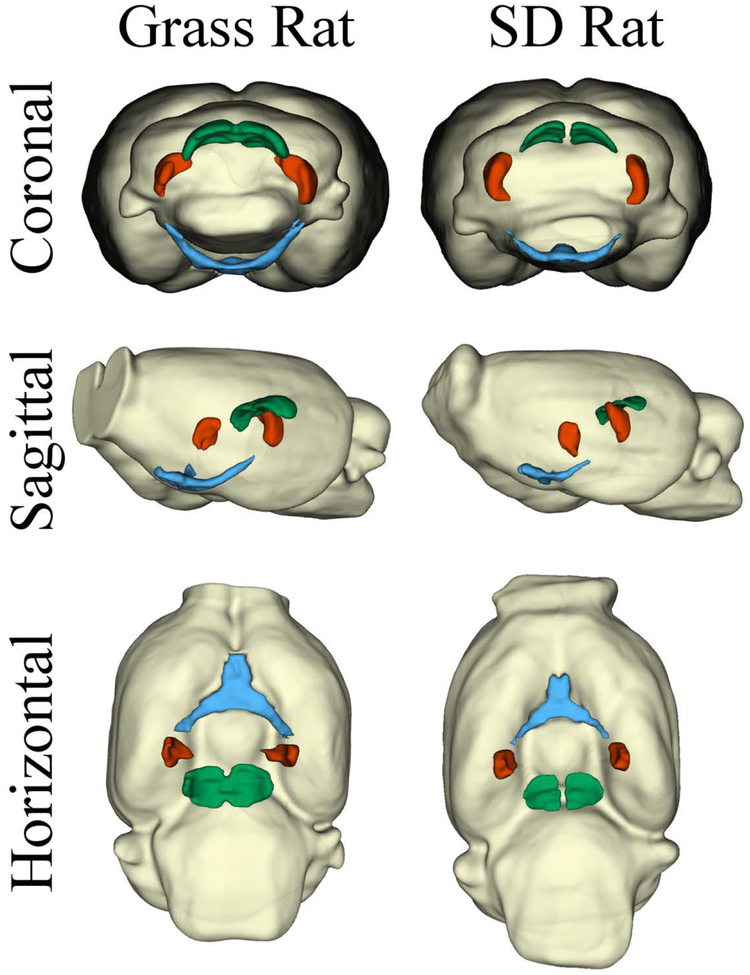
Figure 8.
Three-dimensional volume rendering of visual regions in grass rat and SD rat from 3D MRI. Volumes for the superior colliculus (green), geniculate complex (red) and the optic nerve/tract (blue) are shown in three orientations. The brains of the two species are represented in identical proportions to demonstrate the relative size differences between visual structures. Grass rats have significantly larger regions for the three visual regions illustrated.

