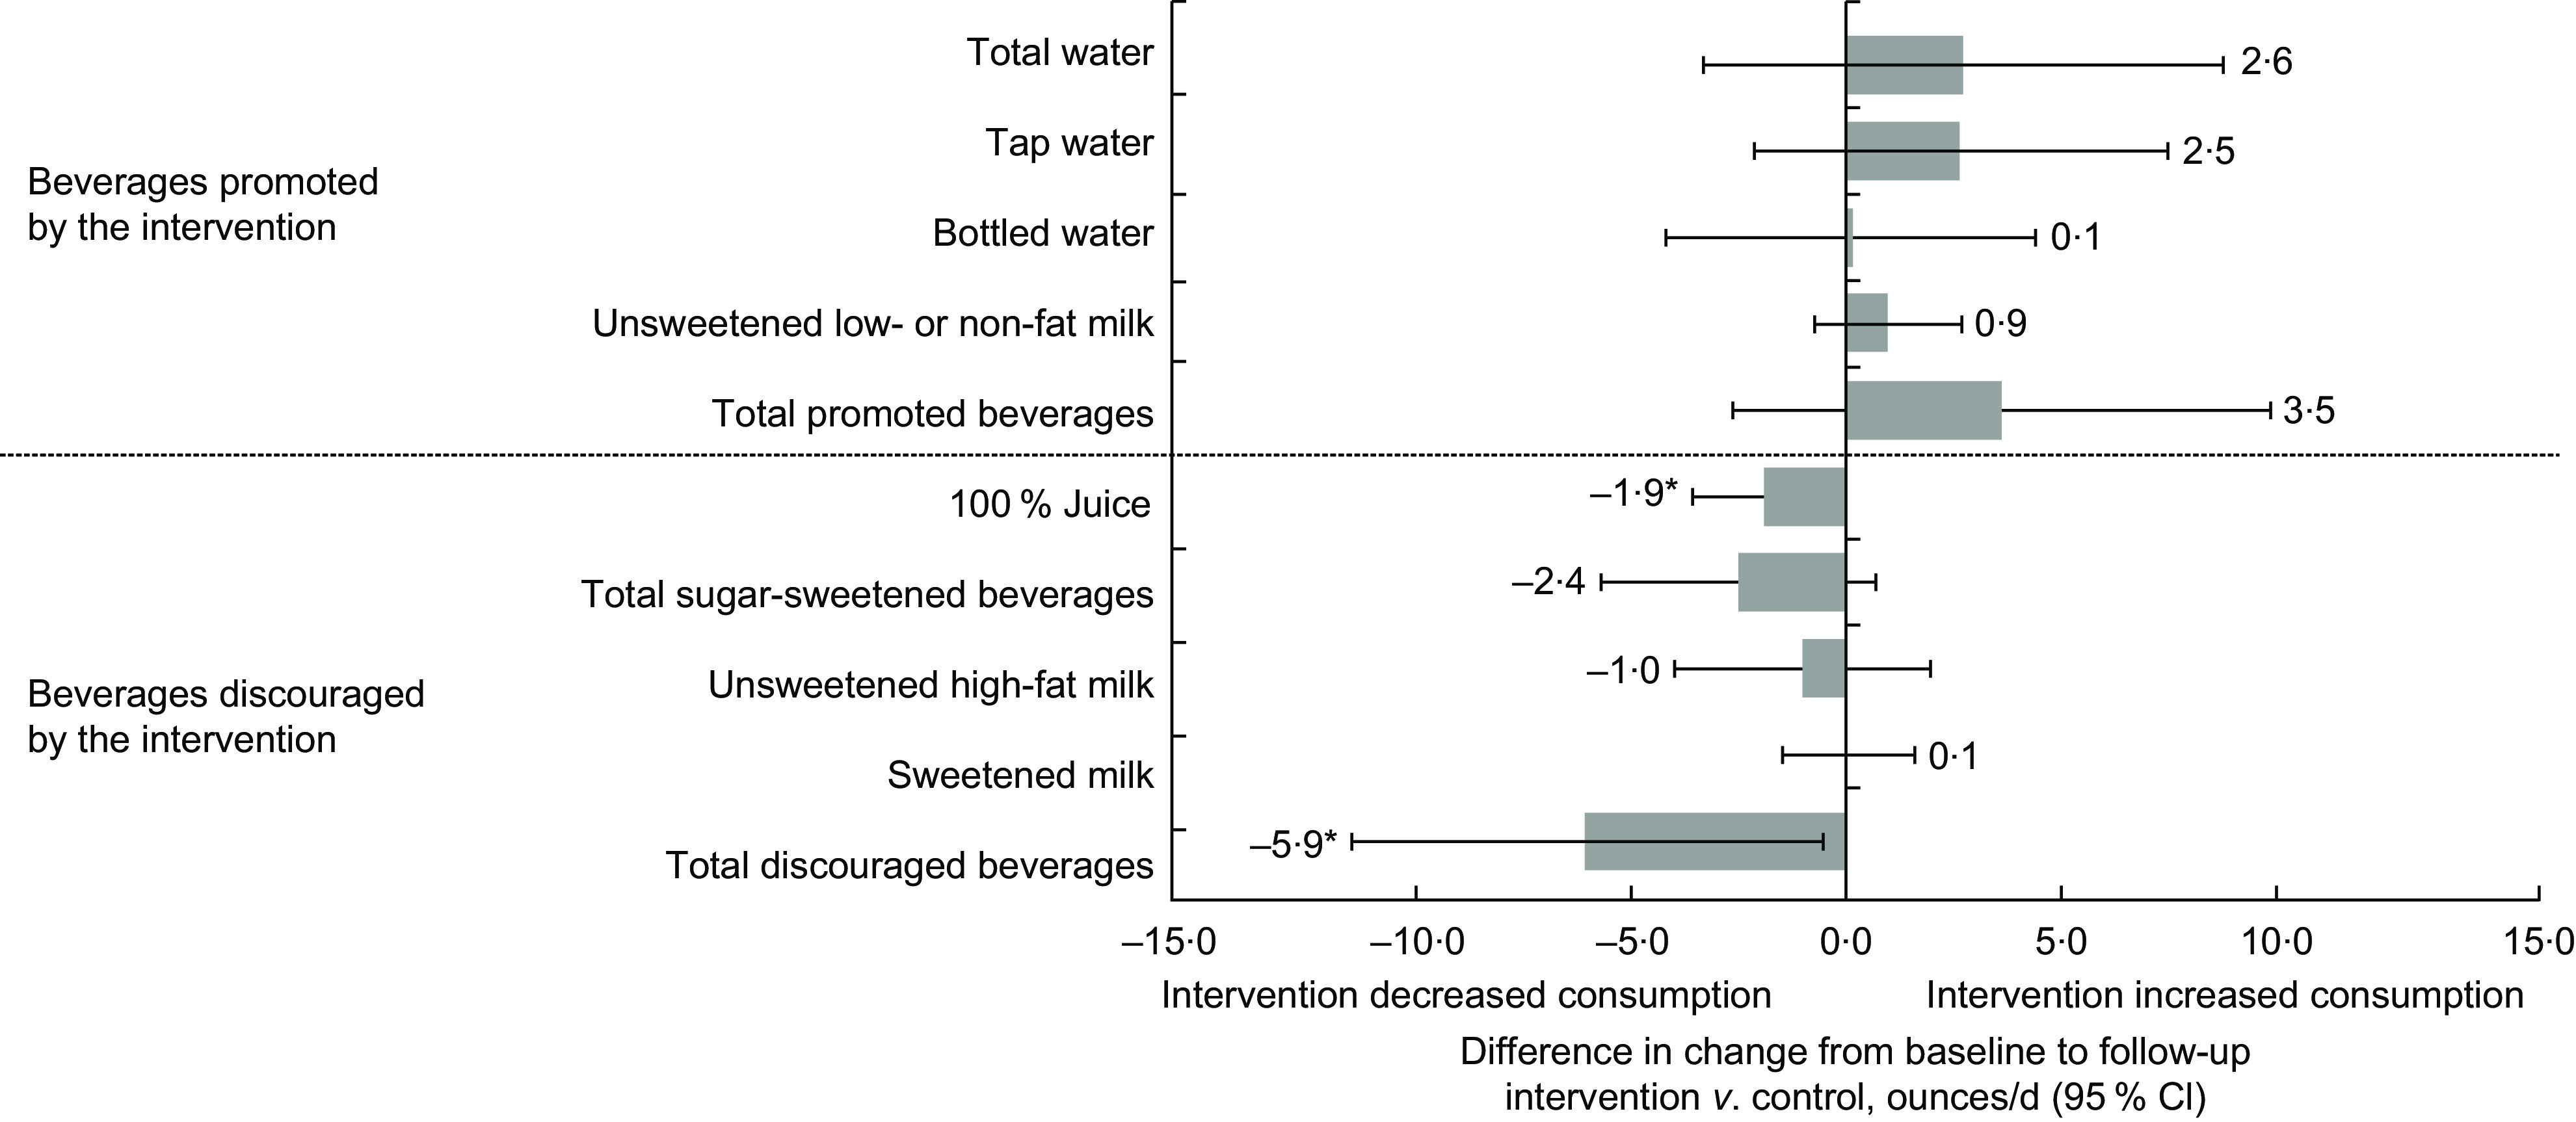
Fig. 3.

Effects of the healthy beverages intervention on 2- to 5-year-old children’s at-home consumption of eleven beverage categories (n 154), two northern California cities, USA, 2013–2014. Figure shows differences in change in consumption from baseline to follow-up ( ), with 95 % CI represented by horizontal bars, comparing the healthy beverages intervention group with the control group, in ounces/d (i.e. US fluid ounces; 1 US fl. oz = 29·57 ml). Differences were estimated using generalized linear regressions, controlling for sociodemographic characteristics, child’s age and child’s sex, and accounting for clustering within children and classrooms. Changes in consumption of sub-categories may not sum to the changes in larger categories due to adjustment for covariates. *P< 0·05
