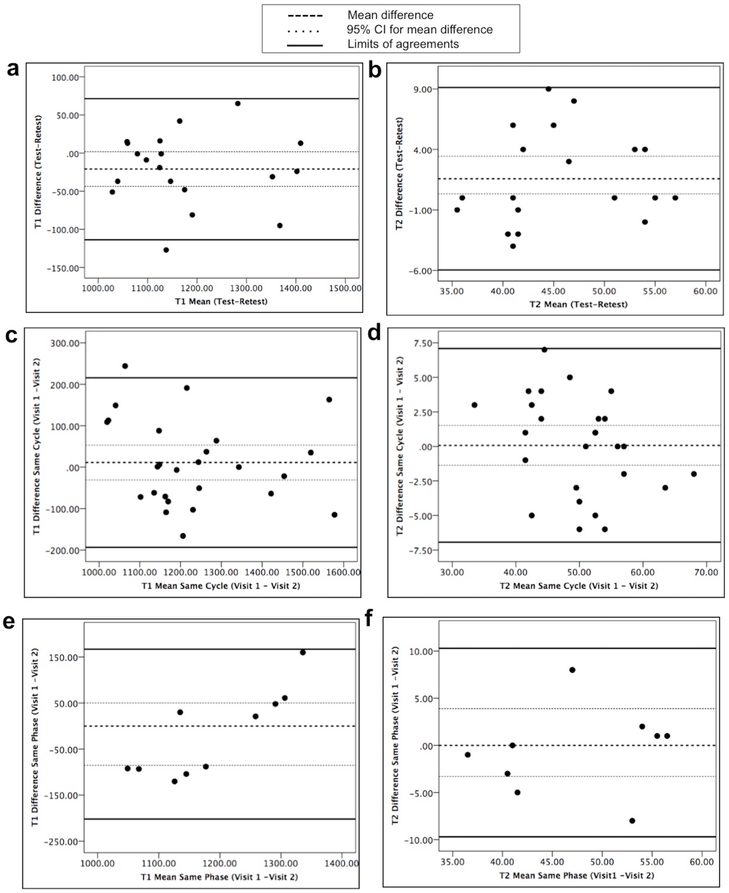
Figure 4:
Bland Altman plots for differences in measurements from two scans versus mean of measurements from two scans. Top row shows T1 (a) and T2 (b) plots for same-day test-retest scans, middle row shows T1 (c) and T2 (d) plots for two-visit scans in different menstrual phases in the same menstrual cycle and bottom row shows T1 (e) and T2 (f) plots for two-visit scans in the same menstrual phase in the next menstrual cycle. Upper and lower solid lines represent LOA, the center dashed line is the mean difference in measurement from two scans with 95% CI of mean difference in dotted lines.

