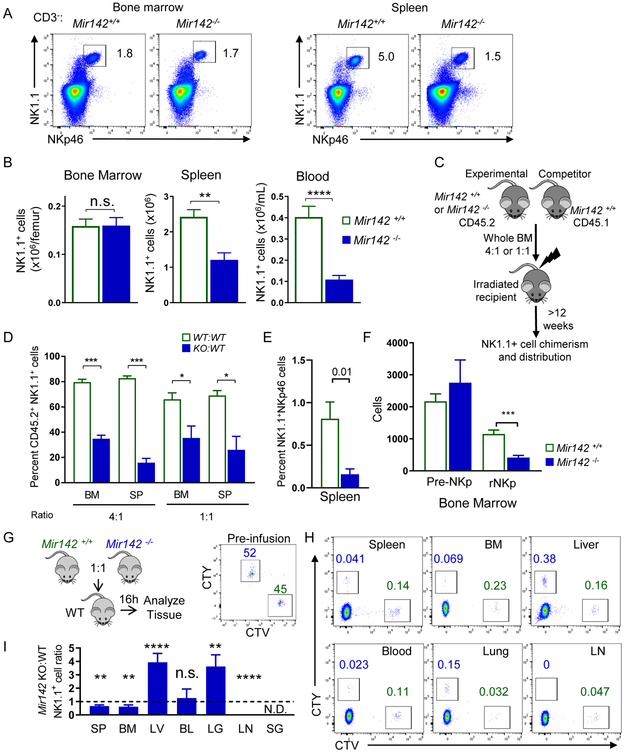
Figure 1. miR-142 deficiency reduces peripheral type-1 ILC numbers and alters trafficking.
BM, SP, and blood (BL) of Mir142+/+ (control, open green) and Mir142−/− (filled blue) were harvested and assessed for type-1 ILCs (CD45+CD3−NK1.1+NKp46+). (A) Representative flow plot of NK1.1+ NKp46+ cells (gated on CD3−) from the SP and BM. (B) Summary data showing the total NK1.1+ NKp46+ cells, see Fig. S1 (C-D) Schema of the BM chimera assay. (D) Summary of 2 independent experiments with >8 mice per group. (E) Non-competitive BM chimera experiment where control or Mir142−/− BM were transferred into congenic, irradiated recipients. Summary data showing percent CD45.2+CD3−NK1.1+NKp46+ cells from 3 independent experiments with 6 mice per group. (F) Summary data showing the NK cell precursor population numbers: pre-NK precursor (pre-NKp) and restricted NK precursor (rNKp). Data are from >3 independent experiments with >12 mice per group. Data were compared using Student’s T test or Mann-Whitney test. (G) Experimental schema for trafficking experiments. Briefly, control and miR142−/− BM cells were differently labeled with cell trace violet and cell trace yellow. The cells were mixed, injected iv. into WT recipients, and tissues examined for the presence of labeled NK1.1+NKp46+ cells. Flow plots of pre-infusion NK1.1+ cells present at 1:1 ratio. (H) Representative flow cytometry showing NK1.1+ cells. (I) Summary data from (H) showing the ratio of control and miR142−/− NK1.1+ cells. N=10 mice from 2 independent experiments. Significance was determined by Wilcoxon signed rank test against the theoretical value of one (no trafficking alteration, dashed line). Please also see Figure S3.

