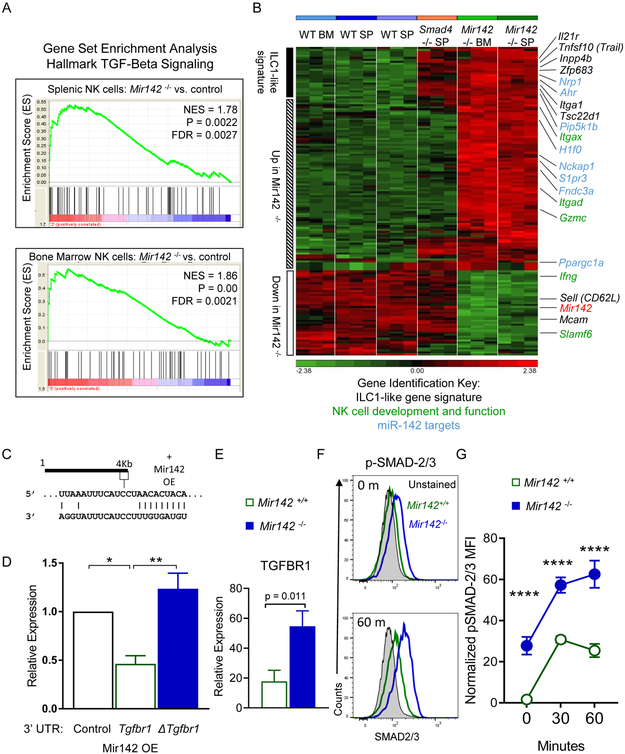
Figure 4. TGF-β signaling is increased in Mir142−/− type-1 ILCs.
(A-B) CD3−NK1.1+NKp46+ cells were flow-sorted from Mir142+/+ (WT) or Mir142−/− (KO) BM or SP and microarray performed. (A) GSEA of the TGF-β Hallmark Signaling Pathway gene set in Mir142−/− versus WT from SP and BM. NES, Normalized enrichment score. (B) Heat map of differentially regulated genes between Mir142+/+, Smad4Δ/Δ, and Mir142−/− NK1.1+ cells. Genes associated with the ILC1-like signature (black), miR-142 targets (blue), and NK cell development and effector functions (green) are indicated. Data are from 3 biological replicates. (C) Predicted miR-142-3p binding site in the 3’UTR of Tgfbr1. (D) Luciferase reporter assay for miR-142 overexpression (OE) without the Tgfbr1 3’UTR (empty), with Tgfbr1 3’ UTR (WT) or with Tgfbr1-mutated at the miR-142-3p binding site in the 3’ UTR (Δ). Data summarize 3 independent experiments and were compared using an ANOVA. (E) Summary TGFBR1 expression on type-1 ILCs from SP of indicated mice (relative expression: median minus FMO); data from > 3 independent experiments were compared with T test (n=6-8 mice per group). (F-G) SP cells were stimulated with 10 ng/mL IL-15 plus 10 ng/mL TGF-β1 or left unstimulated (0 minutes) and assessed for phosphorylated (p) SMAD-2 and/or −3. (F) Representative flow plot showing pSMAD-2 and/or −3 in unstimulated (0m, top) or stimulated (60m, bottom) CD3−NK1.1+ cells. (G) Summary from (F). Data are from 2 independent experiments with 6-7 mice per group. Significance was determined by 2-Way ANOVA. Please also see Figure S4.

