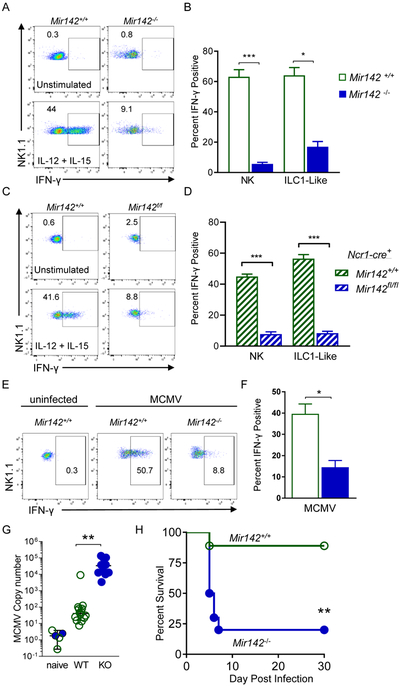
Figure 7. miR-142-deficient type-1 ILCs display altered effector responses in vitro and in vivo.
(A-B) Splenocytes from Mir142+/+ and Mir142−/− mice were stimulated for 6 hours. (A) Representative flow plots showing intracellular IFN-γ staining in CD45+CD3−NK1.1+ cells. (B) Summary data from (A). (C-D) Splenocytes were isolated from Ncr1-cre+ Mir142+/+ (control, open green bars) and Ncr1-cre+ Mir142f/f (filled blue bars) mice and stimulated for 6 hours. (C) Representative flow plots showing intracellular IFN-γ staining in CD45+CD3−NK1.1+YFP+ cells. (D) Summary data from (C). (E-F) 36 hours after MCMV infection, SP NK1.1+ cells were assessed immediately for intracellular IFN-γ protein by flow cytometry. (E) Representative flow plots showing IFN-γ in CD45+CD3−NK1.1+ cells. (F) Summary from (E). (G) Viral copy numbers in the SP of MCMV-naïve control, Mir142+/+ (WT) and Mir142−/− (KO) MCMV-infected mice, were assessed using qPCR 4 days after infection (units: IE1×1000/B-Actin). (H) Mice were infected with 1e5 PFU MCMV and survival assessed. Pooled data from 2-3 independent experiments with >4 mice per group per experiment. Comparisons were made using Student’s T test or Mann-Whitney test, and log-rank (H). See also Figure S7.

