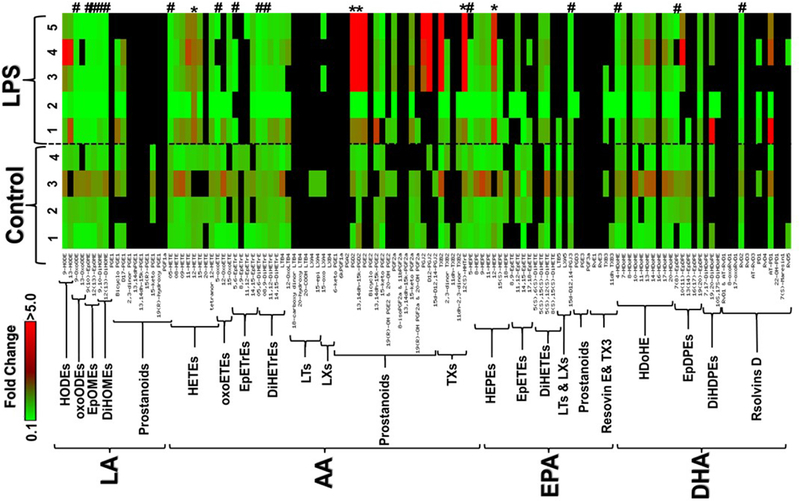
Figure 1.
A clustered heat map of bioactive lipid metabolites in the plasma of LPS-treated mice relative to normal control. These metabolites were grouped into four major groups: linoleic acid (LA), arachidonic acid (AA), eicosapentaenoic acid (EPA), or docosahexaenoic acid (DHA) metabolites followed by subgrouping according to their enzymatic biosynthetic pathways. The significant (P<0.05) increased metabolites were indicated by * whereas decreased metabolites were indicated by #. Data shown for the comparison are the fold change of 4 control and 5 LPS-injected mice relative to the average of control. The highest fold change is represented by the red color, while the lowest fold change is represented by the green color. The undetected metabolite is indicated by the black color.

