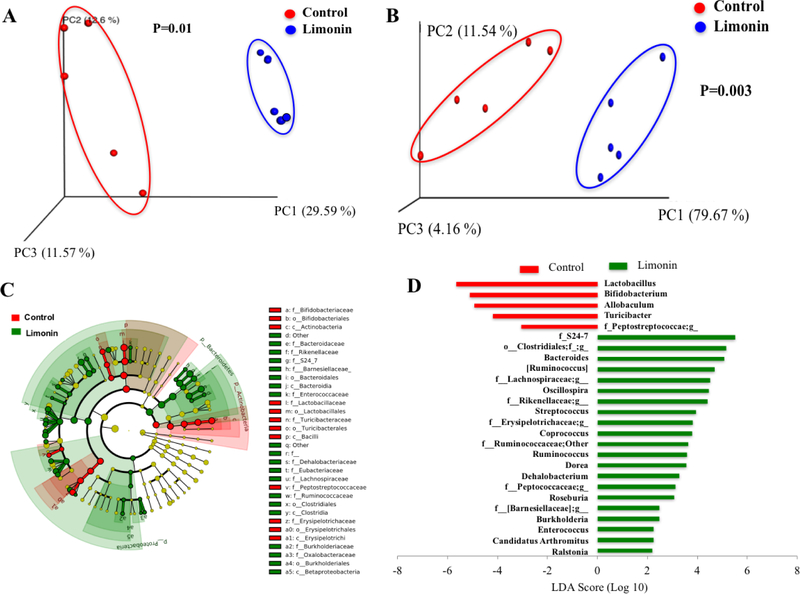
Figure 3.
Principal coordinate analysis (PCoA) of unweighted (A) and weighted (B) UniFrac distances of fecal microbial sample communities arranged in an OTU table at 97% similarity threshold. Each dot represents a sample from each mouse fed diets (five out of ten mice in each group was picked randomly for microbiome analysis). Taxonomic difference of colonic microbiota between control and limonin treated groups identified by linear discriminant analysis (LDA) coupled with effect size (LEFSe) analysis. (C) Taxonomic cladogram representing significant features in microbiota profile with respect to limonin treatment. (D) Gut microbiota genera differentially represented between control and limonin treated groups (LDA > 2, p < 0.05). Red indicating taxa suppressed by limonin treatment, green suggesting taxa enriched by limonin diet.

