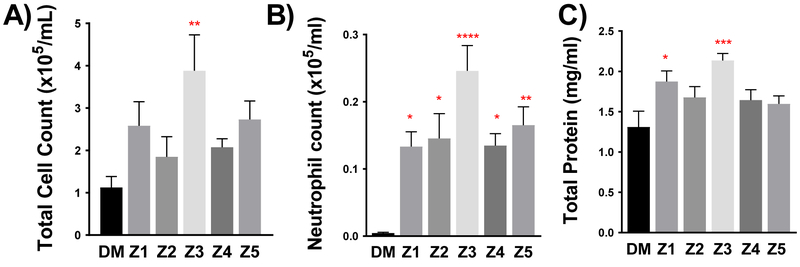
Figure 5.
Pulmonary inflammation and injury markers as assessed by (a) BALF total cell number (b) neutrophil influx in BALF and (c) total protein in cells isolated from BALF. Data are represented as mean ± SEM. Asterisks indicate significant difference from DM control group by one-way ANOVA using Dunnett’s multiple comparison test (*p<0.05, **p<0.01; ***p<0.001; ****p<0.0001; n=7–8 per group). A Neuman-Keuls posthoc test revealed significant differences between neutrophil levels induced by Z3 compared to all other PM groups.

