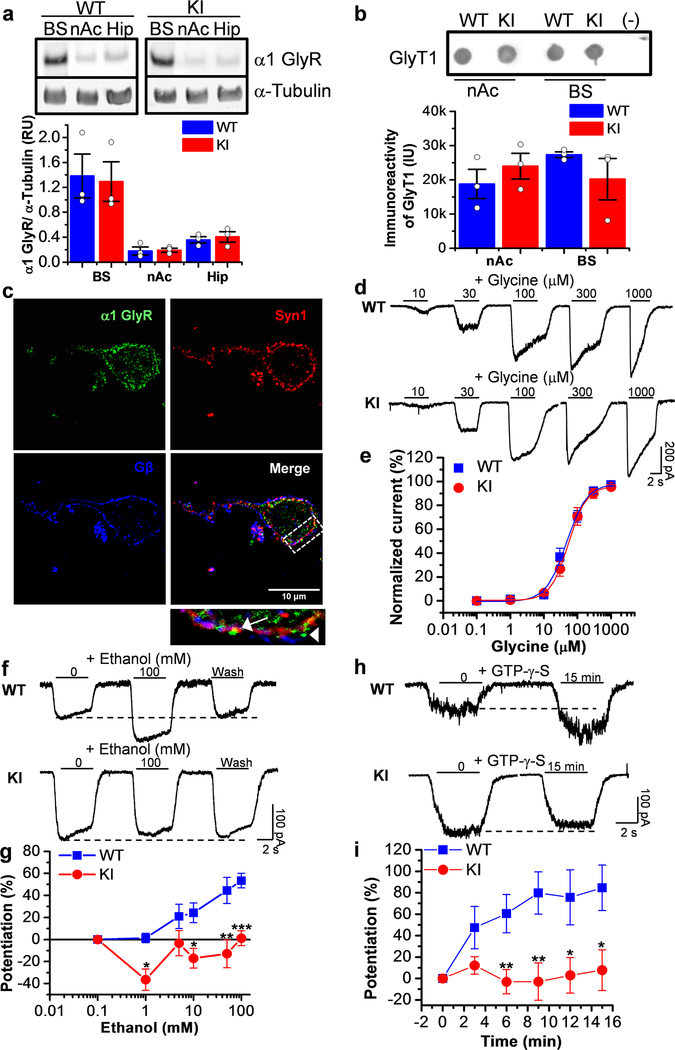
Figure 1. Presence of GlyRs sensitive to the effects of ethanol in nAc.
a) Western blot of brainstem (BS), nucleus accumbens (nAc) and hippocampus (Hip) from WT and KI animals for α1 GlyR and α−tubulin. Western blot analysis shows low levels of α1 GlyR in nAc and Hip and high levels in BS (n=3 animals). b) Dot blot from nAc and BS of WT and KI mice for GlyT1. The graph shows a quantitative analysis of immunoreactivity for GlyT1 in nAc and BS from WT and KI animals (n=3 mice). c) Confocal photomicrograph of dissociated neurons from nAc showing immunoreactivity to α1 GlyR (green), synapsin 1 (red) and Gβ (blue). The presence of colocalization of α1 GlyR with Syn1 represents a synaptic receptor (arrow); while α1 GlyR alone is non-synaptic (arrowhead). The scale bar represents 10 μm. d) Representative traces of glycine evoked currents (1–1000 μM) in dissociated neurons from WT and KI mice. e) The graph shows the glycine concentration-response curve in accumbal neurons from WT (blue squares) and KI mice (red circles). The EC50 was similar in both genotypes: 47 ± 6 μM WT and 54 ± 1 μM KI (WT n=15 neurons from 3 animals and KI n=12 neurons from 2 animals). f) Representative evoked current traces from WT and KI showing the effects of 100 mM ethanol measured with an EC10 of glycine (15 μM). g) The graph summarizes the effect of ethanol concentrations on accumbal neurons from WT (blue squares) and KI (red circles) animals. Data shows positive modulation only in WT neurons (n=12 neurons from 2 WT mice, n=22 neurons from 6 KI mice) (p=0.00675, F1,30= 8.4673). h) Representative evoked current traces from WT and KI showing the effects of G protein activation by intracellular dialysis of GTP-γ-S (0.2 mM) for 15 minutes. i) The time course graph summarizes the effects of G-protein activation by GTP-γ-S in MSNs from WT (blue squares) and KI (red circles) animals. An important potentiation was found only in WT neurons (n=5–8 neurons from 2 WT mice, n=9–11 neurons from 3 KI mice) (p=1.218E−7, F1,94= 32.802). Data are mean ± SEM. *p<0.05, **p<0.01, ***p<0.001. Two-way ANOVA, Tukey test.

