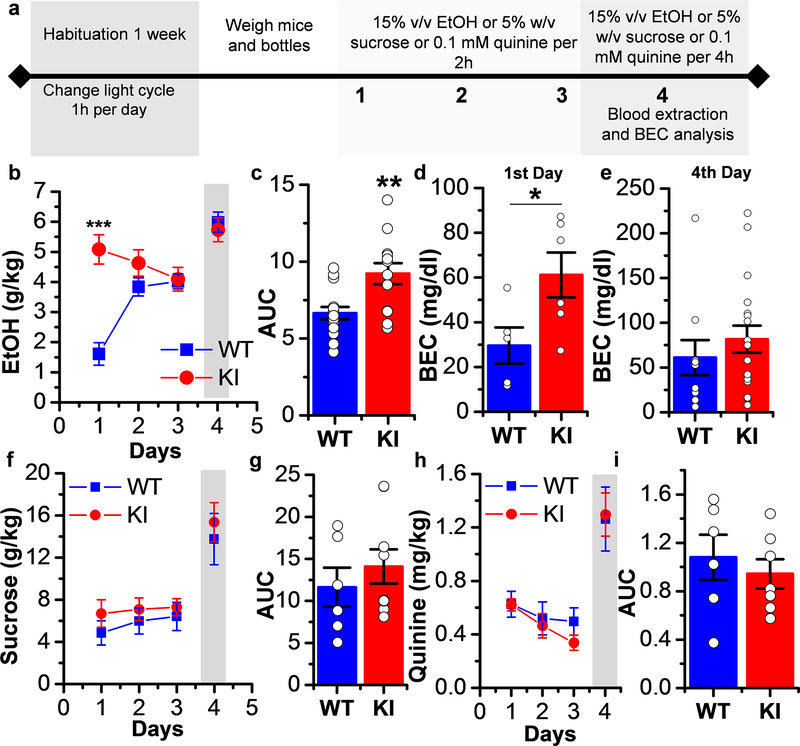
Figure 4. Increased ethanol first exposure consumption without change in sucrose and quinine intake in KI mice.
a) Experimental timeline of DID experiment for ethanol, sucrose or quinine. b) Graph summarizing the DID test in WT and KI mice. The gray shaded bar represents 4 hr sessions rather than the 2 hr sessions on the other days. WT mice had an escalated ethanol consumption, while ethanol consumption in KI mice was elevated for all the days tested (p=1.79281E−6, F3,55= 12.846, n=15 WT mice and n=13 KI mice, Two-way ANOVA, Bonferroni post hoc test). c) Summary graph of area under the curve (AUC) showing a higher area in KI mice (p=0.0026, t26=3.336, Unpaired Student’s t test, n=15 WT mice and n=13 KI mice). d) The graph shows that after the 1st day of consumption KI mice had higher BEC than WT mice (p=0.042, t9= 2.369, Unpaired Student’s t test, n=5 WT mice and n=6 KI mice). e) The graph shows that there were no differences in the blood ethanol concentration between WT and KI mice after the 4th day of consumption (p=0.417, t26= 0.825, Unpaired Student’s t test, n=10 WT mice and n=18 KI mice). f) The graph shows that no differences were found in sucrose consumption between WT and KI mice (n=6 WT mice and n=9 KI mice). The gray shaded bar represents 4 hr sessions rather than the 2 hr sessions on the other days. g) Summary graph of AUC showing no difference in the area between WT and KI mice (p=0.447, t13=0.784, Unpaired Student’s t test, n=6 WT mice and n=9 KI mice). h) The graph shows that no differences were found in quinine consumption between WT and KI mice (p=0.589, F1,47= 0.294, Two-way ANOVA, n=6 WT mice and n=7 KI mice). The gray shaded bar represents 4 hr sessions rather than the 2 hr sessions on the other days. i) Summary graph of AUC showing no difference in the area between WT and KI mice (p=0.539, t11= 0.6334, Unpaired Student’s t test, n=6 WT mice and n=7 KI mice). Data represent mean ± SEM. *p<0.05, **p<0.01, ***p<0.001.

