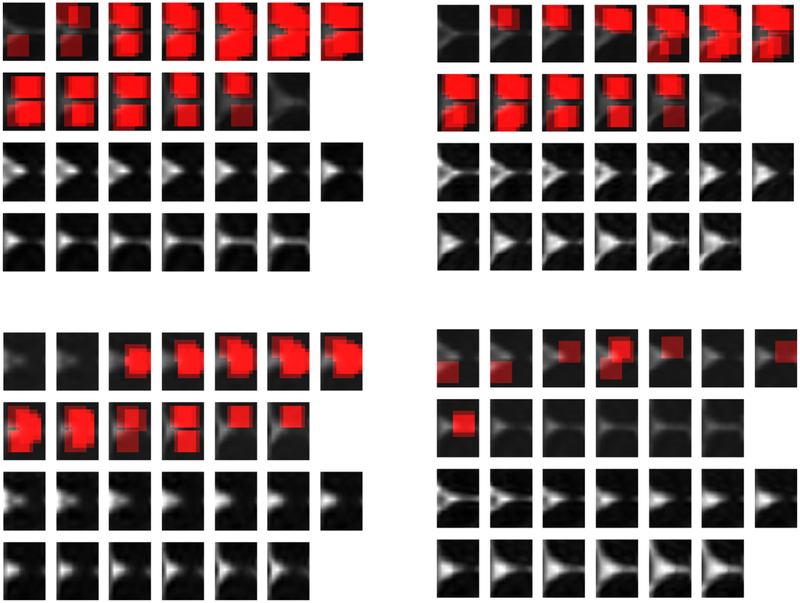
Fig. 11:
Localization heatmaps corresponding to a chosen word in thalamus and MD metric. The figures in top row denote the heatmaps for two patient subjects, and the heatmaps in bottom row denotes the heatmaps for two controls. In each figure, the first two rows denote the location of chosen words in different parts of 13 thalamus slices, and the next two rows denote the actual MD metrics in thalamus for those subjects.

