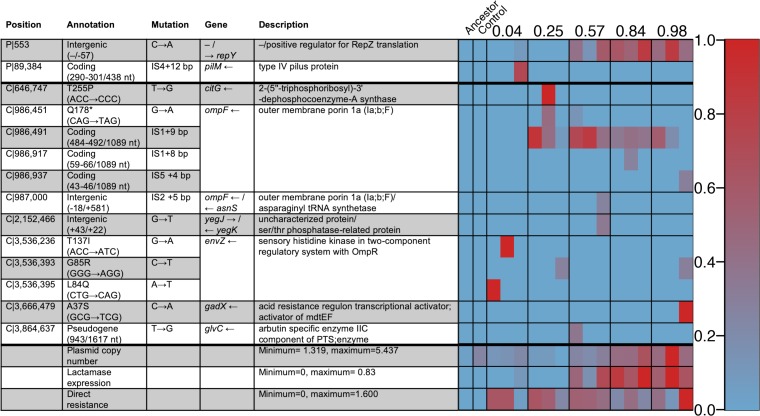
FIG 6.
Table and heatmap showing the genetic changes observed in populations adapted to high dose strengths at different amoxicillin/clavulanate proportions. (Left) The columns of the heatmap show the 17 different sequenced populations, with three replicates for the different amoxicillin proportions (listed above). The rows show either genetic changes (found in at least one strain at a frequency of 20% or greater) with the plasmid (P) or chromosomal (C) location or general features of the genomes such as plasmid copy number and summed frequency of mutations giving direct and β-lactamase-mediated resistance to co-amoxicillin. nt, nucleotide; PTS, phosphotransferase system. (Right) Frequencies of individual mutations range from 0% (blue) to 100% (red), while general features range from the minimum and maximum values listed, on the same color scale.

